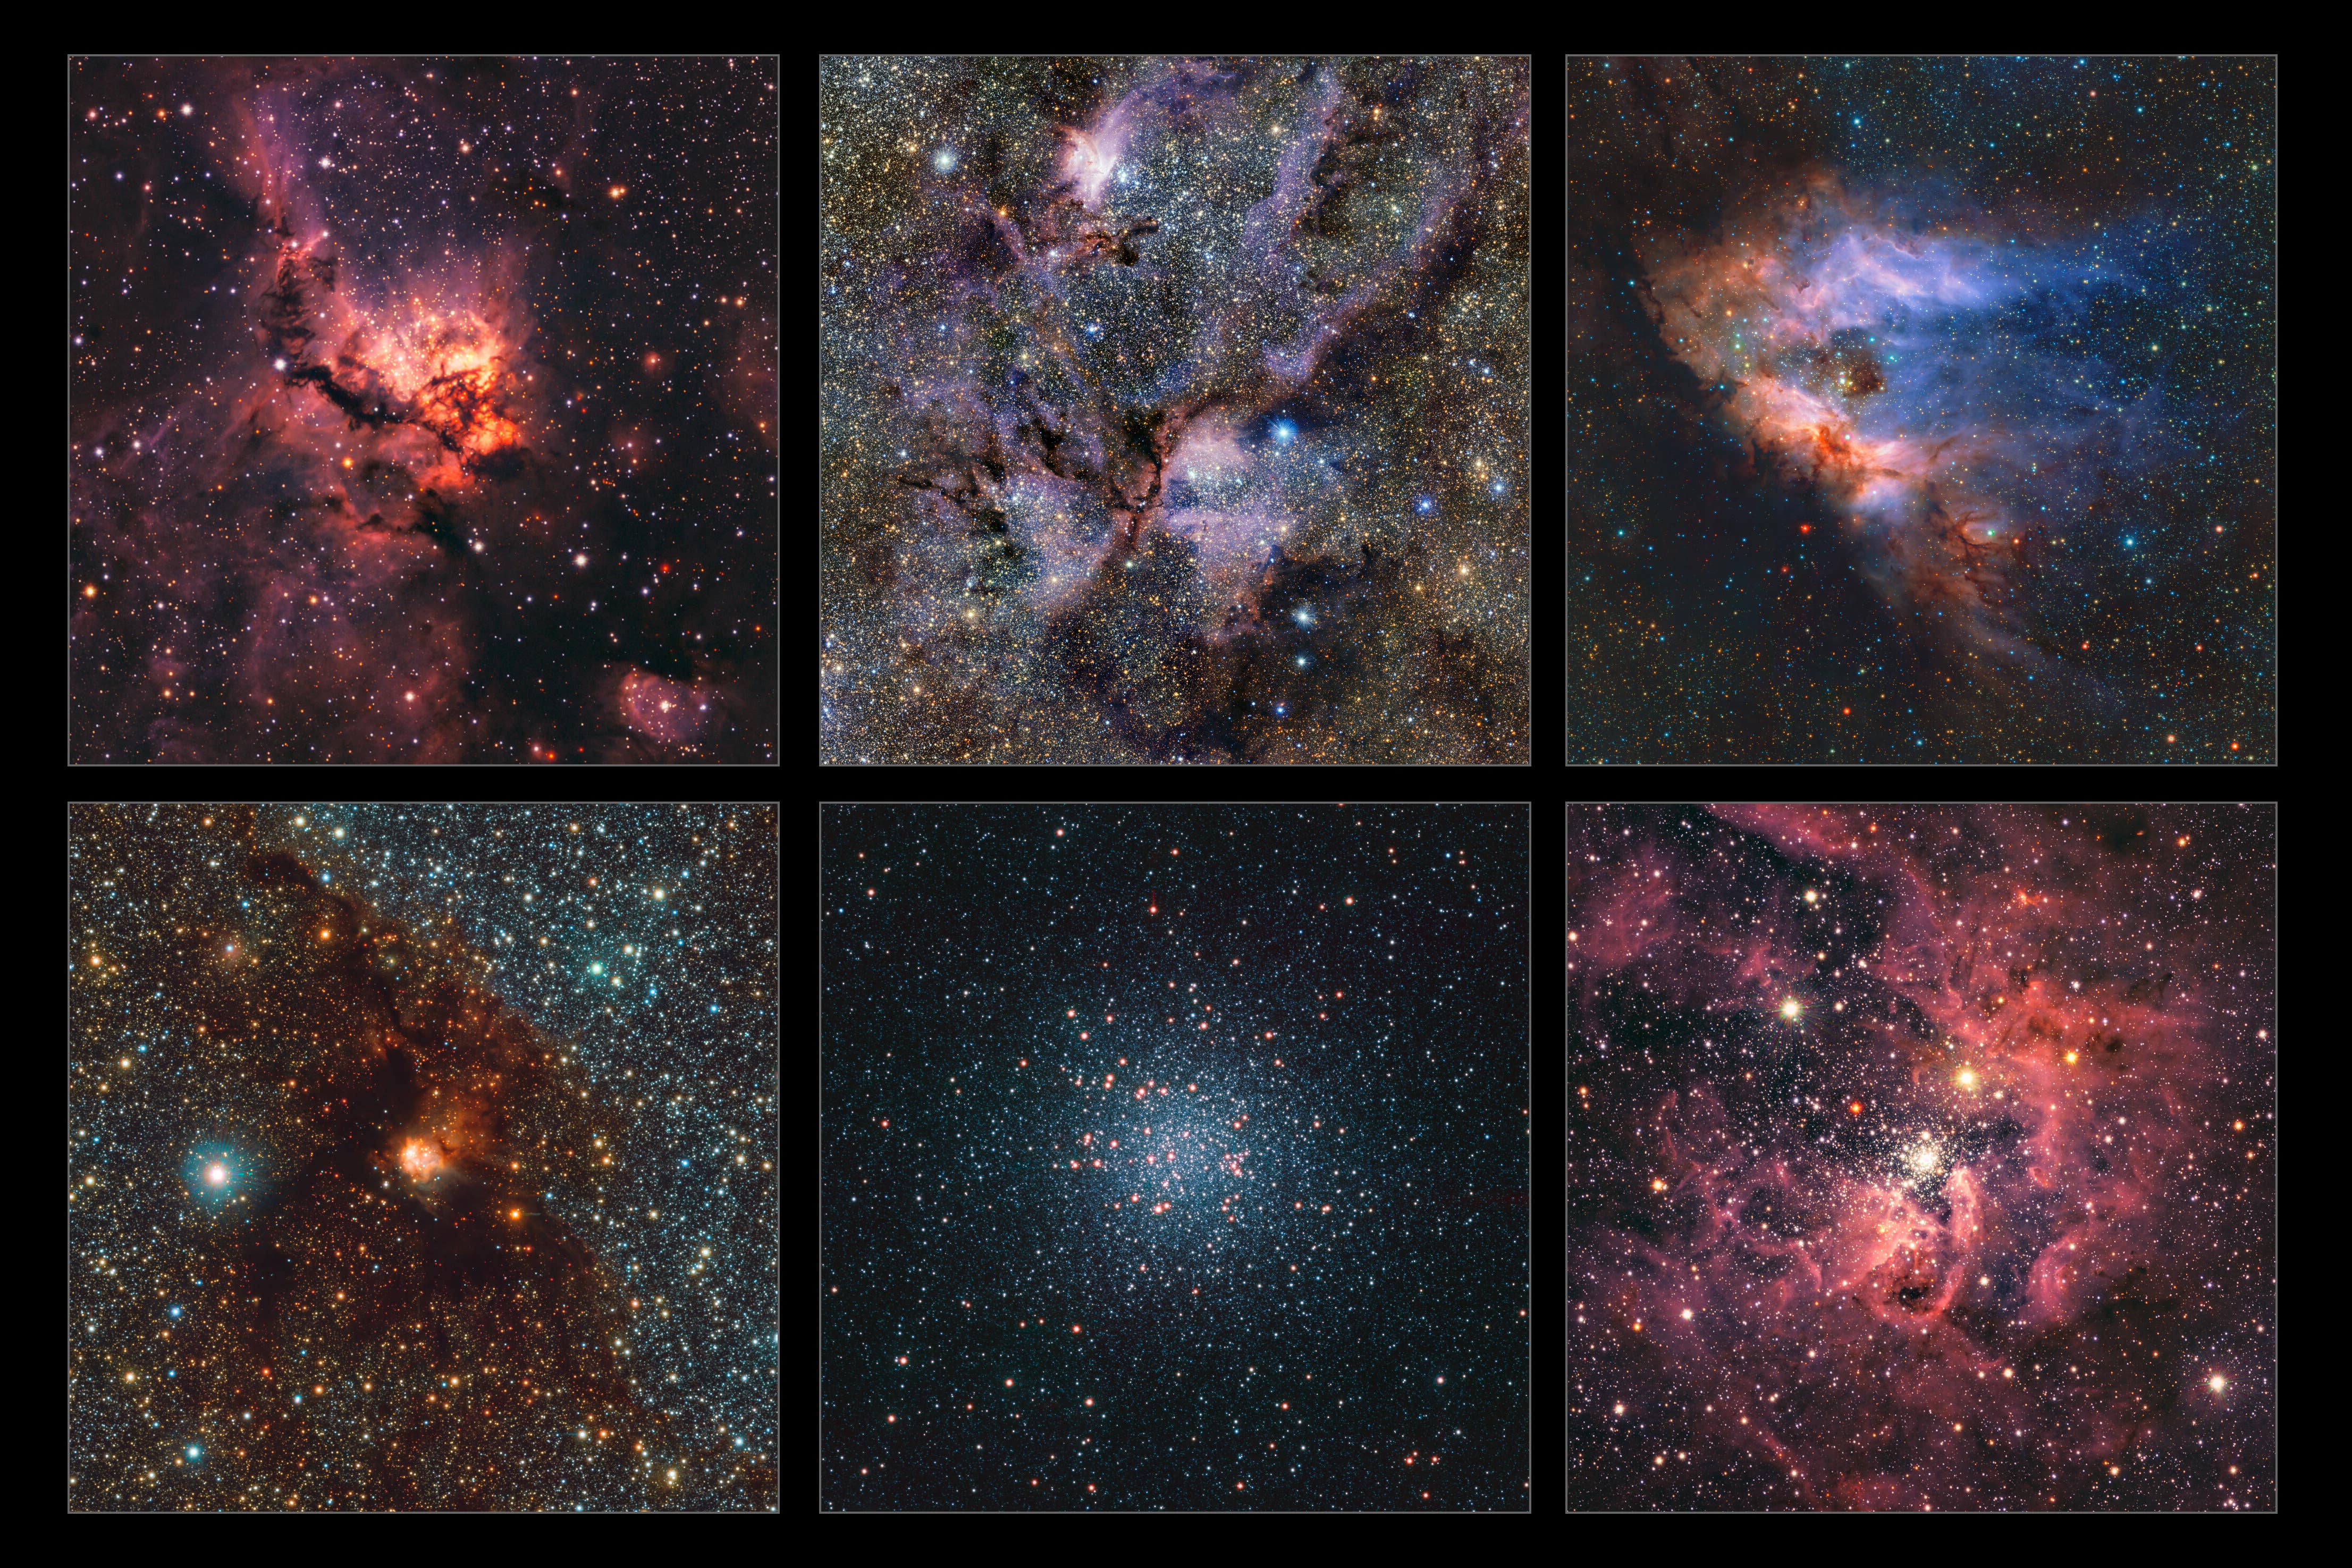
Astronomers unveil most detailed map of the Milky Way
The data covers an area of the sky equivalent to 8,600 full moons.

Astronomers have published a gigantic map of the Milky Way, unveiling discoveries that have changed their view of the galaxy “forever”.
The infrared map contains more than 1.5 billion objects, including newborn stars, making it the most detailed one ever made.
Using the European Southern Observatory’s (ESO) Visible and Infrared Survey Telescope for Astronomy (Vista) telescope, the scientists monitored the central regions of the Milky Way for more than 13 years.
Dante Minniti, an astrophysicist at Universidad Andres Bello in Chile who led the overall project, said: “We made so many discoveries, we have changed the view of our galaxy forever.”
The data covers an area of the sky equivalent to 8,600 full moons, and contains about 10 times more objects than a previous map released by the same team back in 2012.
Observing infrared light also enables the telescope to spot very cold objects, which glow at these wavelengths, such as brown dwarfs – failed stars that do not have sustained nuclear fusion, or free-floating planets that do not orbit a star.
The huge infrared map comes in at 500 terabytes of data, making it the largest observational project ever carried out with an ESO telescope.
Infrared light is invisible to the human eye, but it is emitted by all objects based on their temperature.
The telescope can detect and translate this energy into a visual image, creating the pictures that we see.
The map is made up of 200,000 images taken by Vista, which is located at the ESO’s Paranal Observatory in Chile.
Vista’s infrared camera can peer through the dust and gas that is spread throughout our galaxy, and is therefore able to see the radiation from the Milky Way’s most hidden places.
The astronomers started in 2010 and ended in the first half of 2023, spanning a total of 420 nights.
By observing each patch of the sky many times, the team was able to determine the locations of these objects, and also track how they move and whether their brightness changes.
Dr Oscar Gonzalez, senior project scientist at the UK Astronomy Technology Centre (UK ATC) and co-author on the new Astronomy and Astrophysics paper, said: “The completion of the largest infrared map of the Milky Way is a remarkable achievement for the astronomy community.
“The data has provided unprecedented insights into the structure and composition of the Milky Way and will continue to open new avenues for future research that will enhance our understanding of the universe for years to come.”
Bookmark popover
Removed from bookmarks