Map shows why Donald Trump could be disastrous for Republicans
Controversial politician would be unlikely to get a historic drubbing, but a poor performance could damage the election chances of other Republicans

Your support helps us to tell the story
From reproductive rights to climate change to Big Tech, The Independent is on the ground when the story is developing. Whether it's investigating the financials of Elon Musk's pro-Trump PAC or producing our latest documentary, 'The A Word', which shines a light on the American women fighting for reproductive rights, we know how important it is to parse out the facts from the messaging.
At such a critical moment in US history, we need reporters on the ground. Your donation allows us to keep sending journalists to speak to both sides of the story.
The Independent is trusted by Americans across the entire political spectrum. And unlike many other quality news outlets, we choose not to lock Americans out of our reporting and analysis with paywalls. We believe quality journalism should be available to everyone, paid for by those who can afford it.
Your support makes all the difference.There's a terrific piece in the New York Times that lays out how difficult it will be for Donald Trump to get to the 270 electoral votes he would need to be elected the country's 45th president this November. Here's the key line (the boldface is mine):
But without an extraordinary reversal — or the total collapse of whoever becomes his general-election opponent — Mr. Trump could be hard-pressed to win more than 200 of the 270 electoral votes required to win.
That got me to thinking. What would a worst-case-scenario map look like for Trump in a race against Hillary Clinton -- and what would that mean for Republicans' prospects of holding onto their majorities in the House and the Senate?
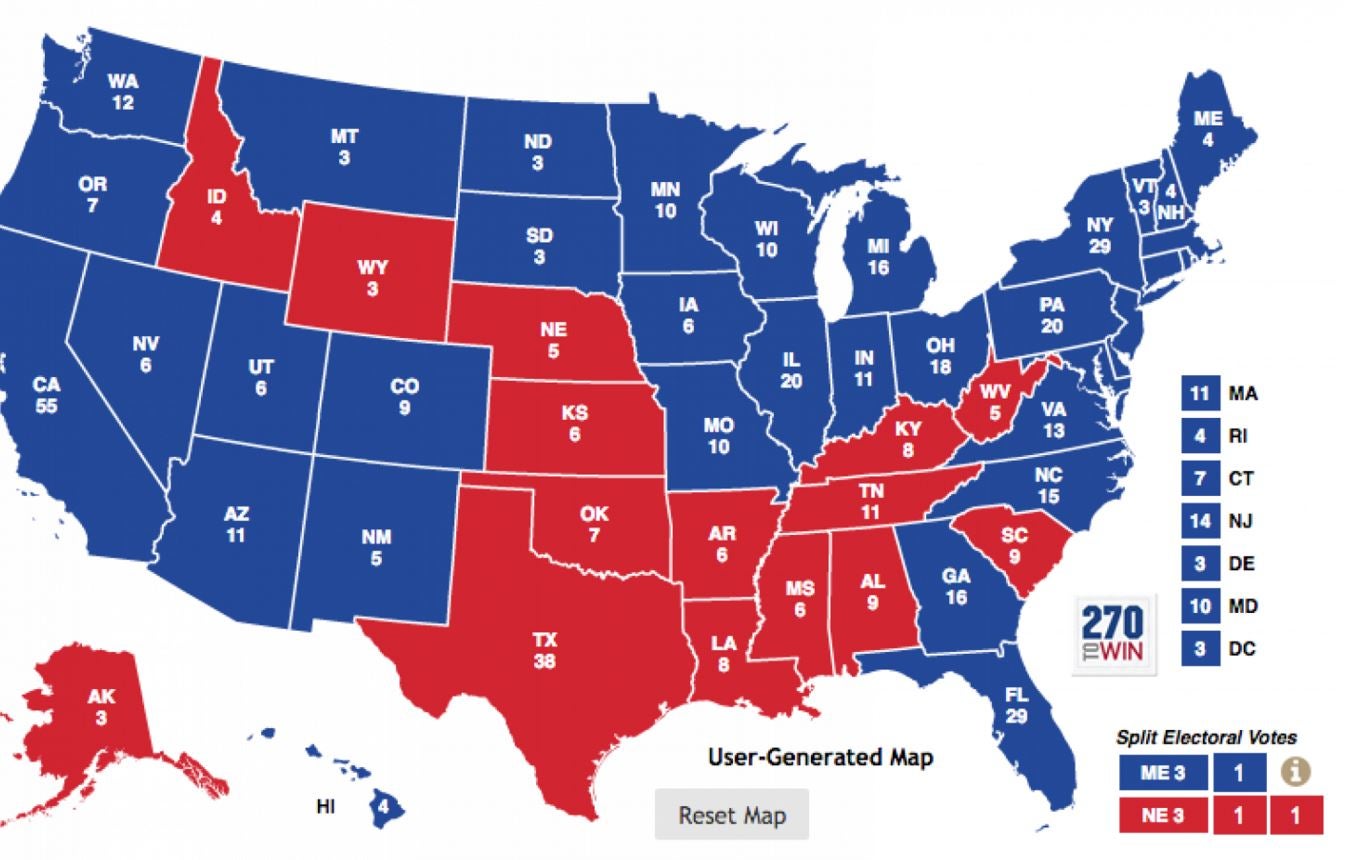
Thanks to the good people at 270towin.com, I built this worst-case scenario map for Trump:

That map gives Clinton 410 electoral votes to 128 for Trump. Clinton would win 34 states and the District of Columbia to 16 for Trump. (By comparison, President Obama won 26 states and D.C. in 2012 to Mitt Romney's 24 states.)
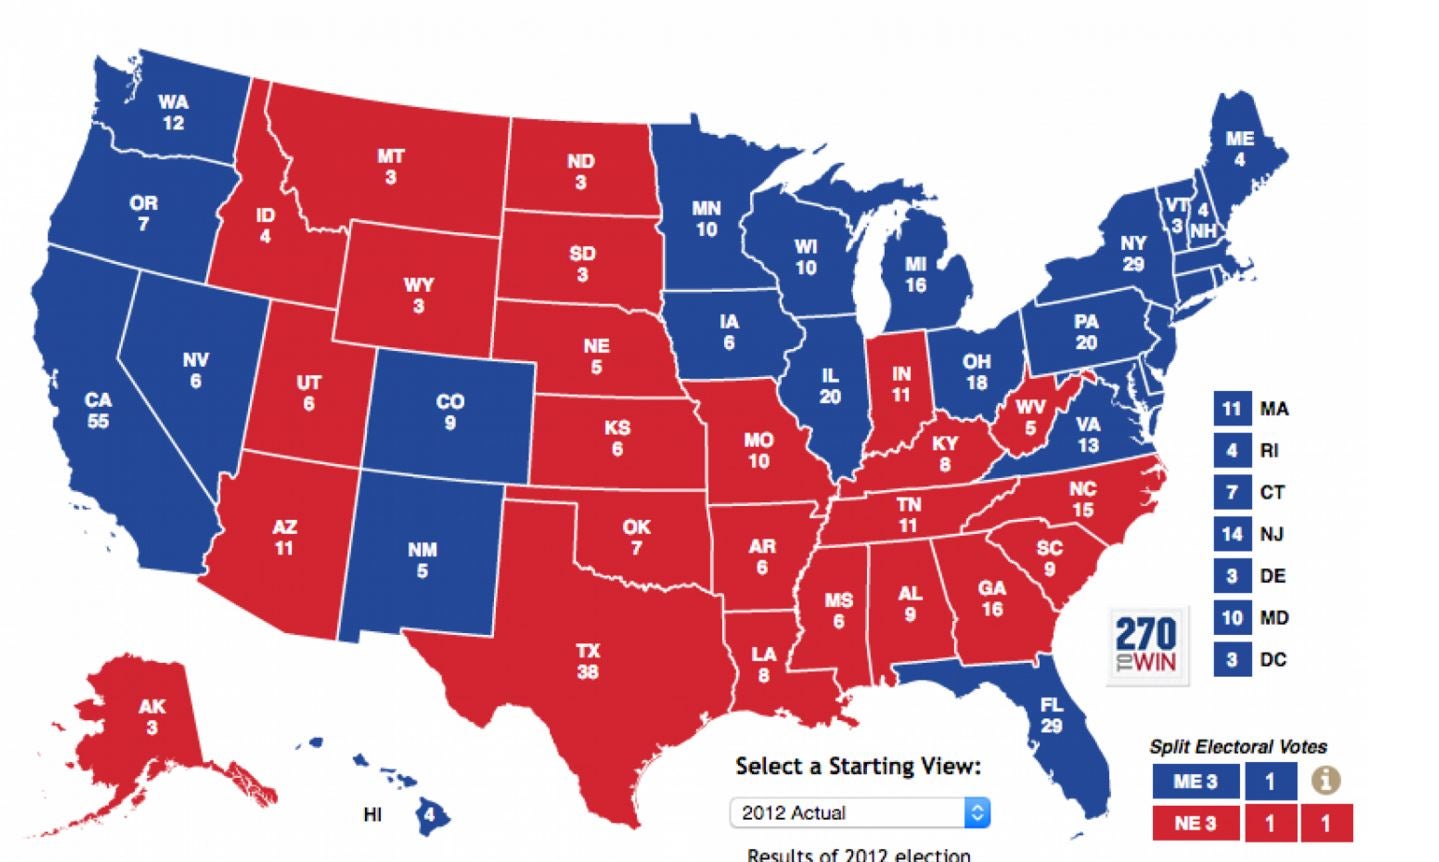
How did I arrive at that map? I started with the 2012 map that gave Obama 332 electoral votes to 206 for Romney. That's this:

I then subtracted the swing-y states Romney won (Arizona, Georgia, Missouri and North Carolina) under the theory that Trump could lose any state with a significant minority population that was even marginally competitive in 2012. I took Utah from Trump, given how poorly he has performed in states and regions with heavily Mormon populations. North Dakota and South Dakota went to John McCain with only 53 percent in 2008, so, in a Trump worst-case scenario, they would go to Clinton. Ditto Montana, where McCain got 50 percent in 2008 and Romney took 55 percent in 2012. Indiana went Democratic as recently as 2008, making it a plausible pickup for Clinton if everything went south for Trump.
That gets Trump down to 128. Which, in truth, isn't a historic drubbing. In fact, it wouldn't even make it into the top five worst electoral college losses in the post-World War II era. To do that, Trump would need 73 or fewer electoral votes. (Dwight D. Eisenhower beat Adlai Stevenson 457 to 73 in 1956.)
Why isn't Trump's worst-case scenario all that bad, historically speaking? The Times piece explains it rightly: "The country’s politics have become so sharply polarized that no major-party contender is likely to come near the 49-state defeats suffered by Democrats in 1972 and 1984."
The country is simply too partisan for anyone -- up to and including Trump -- to win zero, one or two states. Obama won a major national victory in 2008 -- and took a total of 365 electoral votes. There are simply a bunch of states that will not vote for one party or the other no matter whom that party nominates. That will be especially true in some of these traditionally Republican states if Clinton is the Democratic nominee.
And so, even under Trump's worst-case scenario map, he wins 128 electoral votes and 16 states -- including the electoral college behemoth of Texas. The states that stay red on that Trump worst-case scenario map are rightly understood as states that I simply cannot imagine would choose Clinton over anyone with an "R" after their name.
What does that mean for downballot Republicans? Some of that depends on how big Trump loses their states. If Trump loses Ohio by, say, eight to 10 points, then it would be very, very hard for Sen. Rob Portman (R) to get reelected. If Trump loses by five points or less, Portman has a chance. Ditto Richard Burr in North Carolina, Kelly Ayotte in New Hampshire and the Republican nominee in Florida's open seat Senate race. (I think Mark Kirk of Illinois and Ron Johnson of Wisconsin may lose with or without Trump at the top of the ticket.)
In the House, the margin of Trump's losses in each state also matters a ton. In 2008, Obama won the popular vote over McCain by almost 10 million votes. If Trump lost by, say, 15 million votes (or even more), it would be hugely problematic for any congressional Republican in an even marginally competitive state or district.
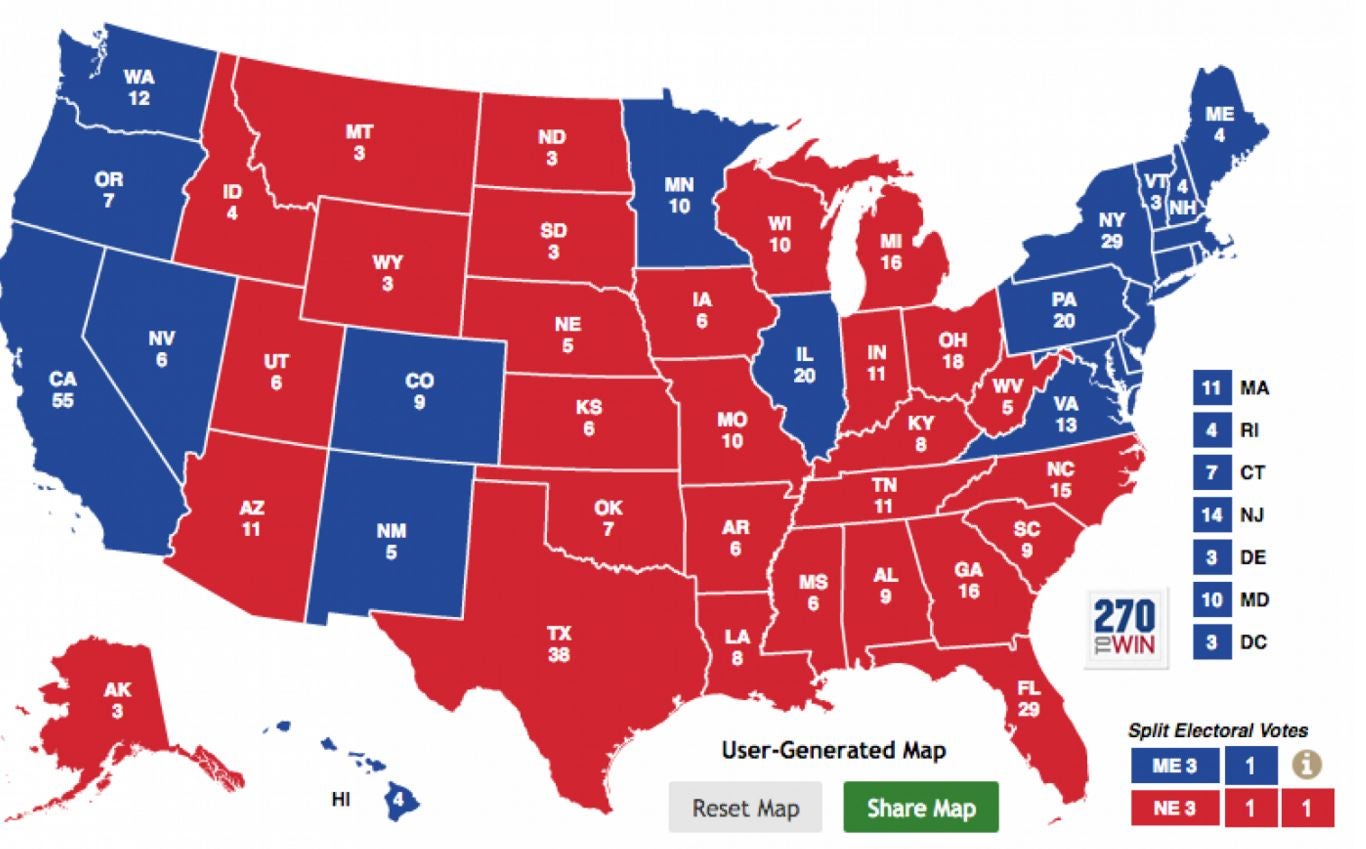
There's no debate that Trump's electoral college floor is lower than that of any other possible Republican nominee in recent memory. You could also argue -- as I have -- that his electoral college ceiling is higher than (or at least different from) any of the party's past nominees. For what it's worth, here's what a Trump best-case-scenario map might look like.

That's Trump at 285 electoral votes, 15 more than he would need to become president.
That's not a great best-case scenario, particularly when the worst case-scenario puts Trump at 128 electoral votes. Those two numbers are what have establishment Republicans so worried about the idea of Trump as their nominee -- and why they are trying so hard to keep it from happening.
Copyright: The Washington Post
Join our commenting forum
Join thought-provoking conversations, follow other Independent readers and see their replies
Comments