Here’s the completely legal way to ‘rig’ an election
While Donald Trump is light on the specifics of how the current US election might have been rigged, the truth of the matter is that lawmakers already have numerous legal options at their disposal for tipping the scales of democracy

An unshackled Donald Trump is barreling down the final stretch of the campaign, making bold and unsubstantiated claims about voter fraud and rigged elections the centerpiece of his closing arguments to American voters.
While Trump is light on the specifics of how this alleged election-rigging works, it seems to involve some combination of media bias and official complicity running all the way from precinct ballot boxes to the director of the FBI.
The truth of the matter is that lawmakers already have numerous legal options at their disposal for tipping the scales of democracy in one direction or another. Changing the composition of the electorate - by enacting restrictions on who can vote, or at what times, or on the ID required to fill out a ballot - are one way to do this.
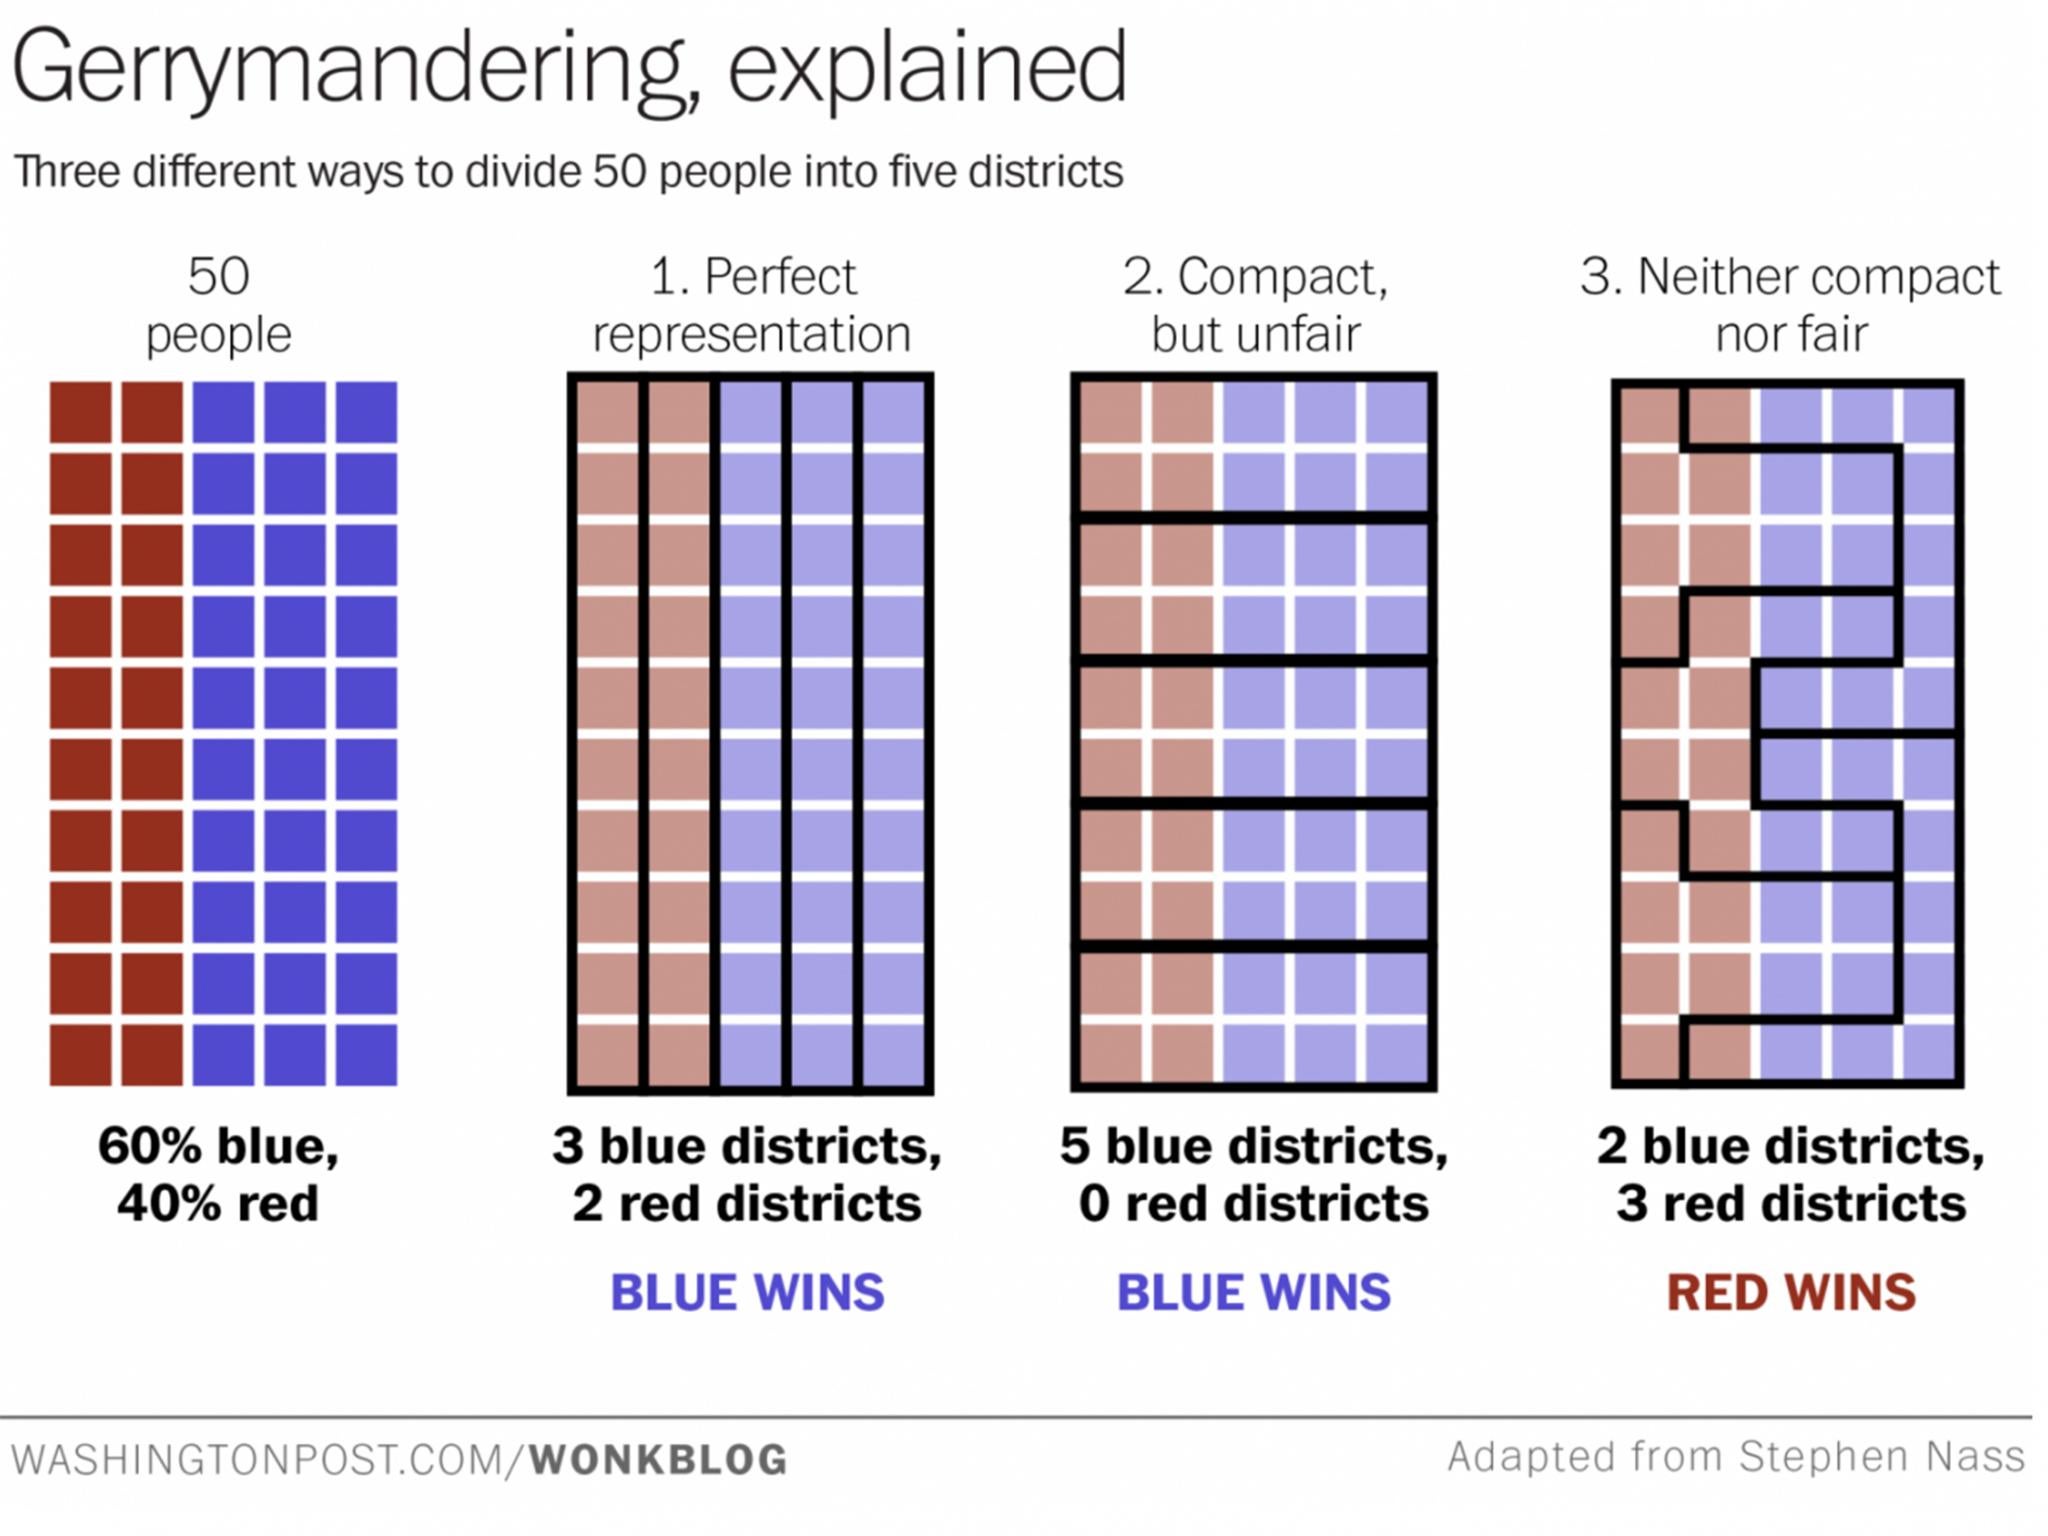
But lawmakers can also change the way that votes translate into political representation by changing the geography of political districts to beef up their parties' representation in state and federal legislatures. The official term for this is “gerrymandering“ - drawing political boundaries to give your party a numeric advantage over the opposition. Here's how it works, in simplified, abstract terms:

Say you have the 50 people represented by the red and blue squares above. Depending on how you draw the lines, you can set up legislative boundaries that either closely represent the red/blue party split (first example), hand all the seats over to the blue party (second example), or hand a majority of seats to the red party, even though they make up only 40 percent of voters (third example). You can learn more about it here.
In practical terms, gerrymandering can have very real effects on the composition of legislatures. The most famous recent example of this is the 2012 election.
That year, Democratic candidates for US House seats earned about 1.2 million votes more than Republican candidates did across the nation. You might reasonably infer that those results would produce a majority-Democratic US House.
But they didn't. In fact, Republicans won 33 more seats in the House than the Democrats did. To put it another way, Republicans won 49 percent of the popular House vote, but 54 percent of the seats.
Many people blamed this on the redrawing of the House legislative districts following the 2010 census. In 2011 and 2012, when this redistricting happened, a majority of state legislatures were under Republican control.
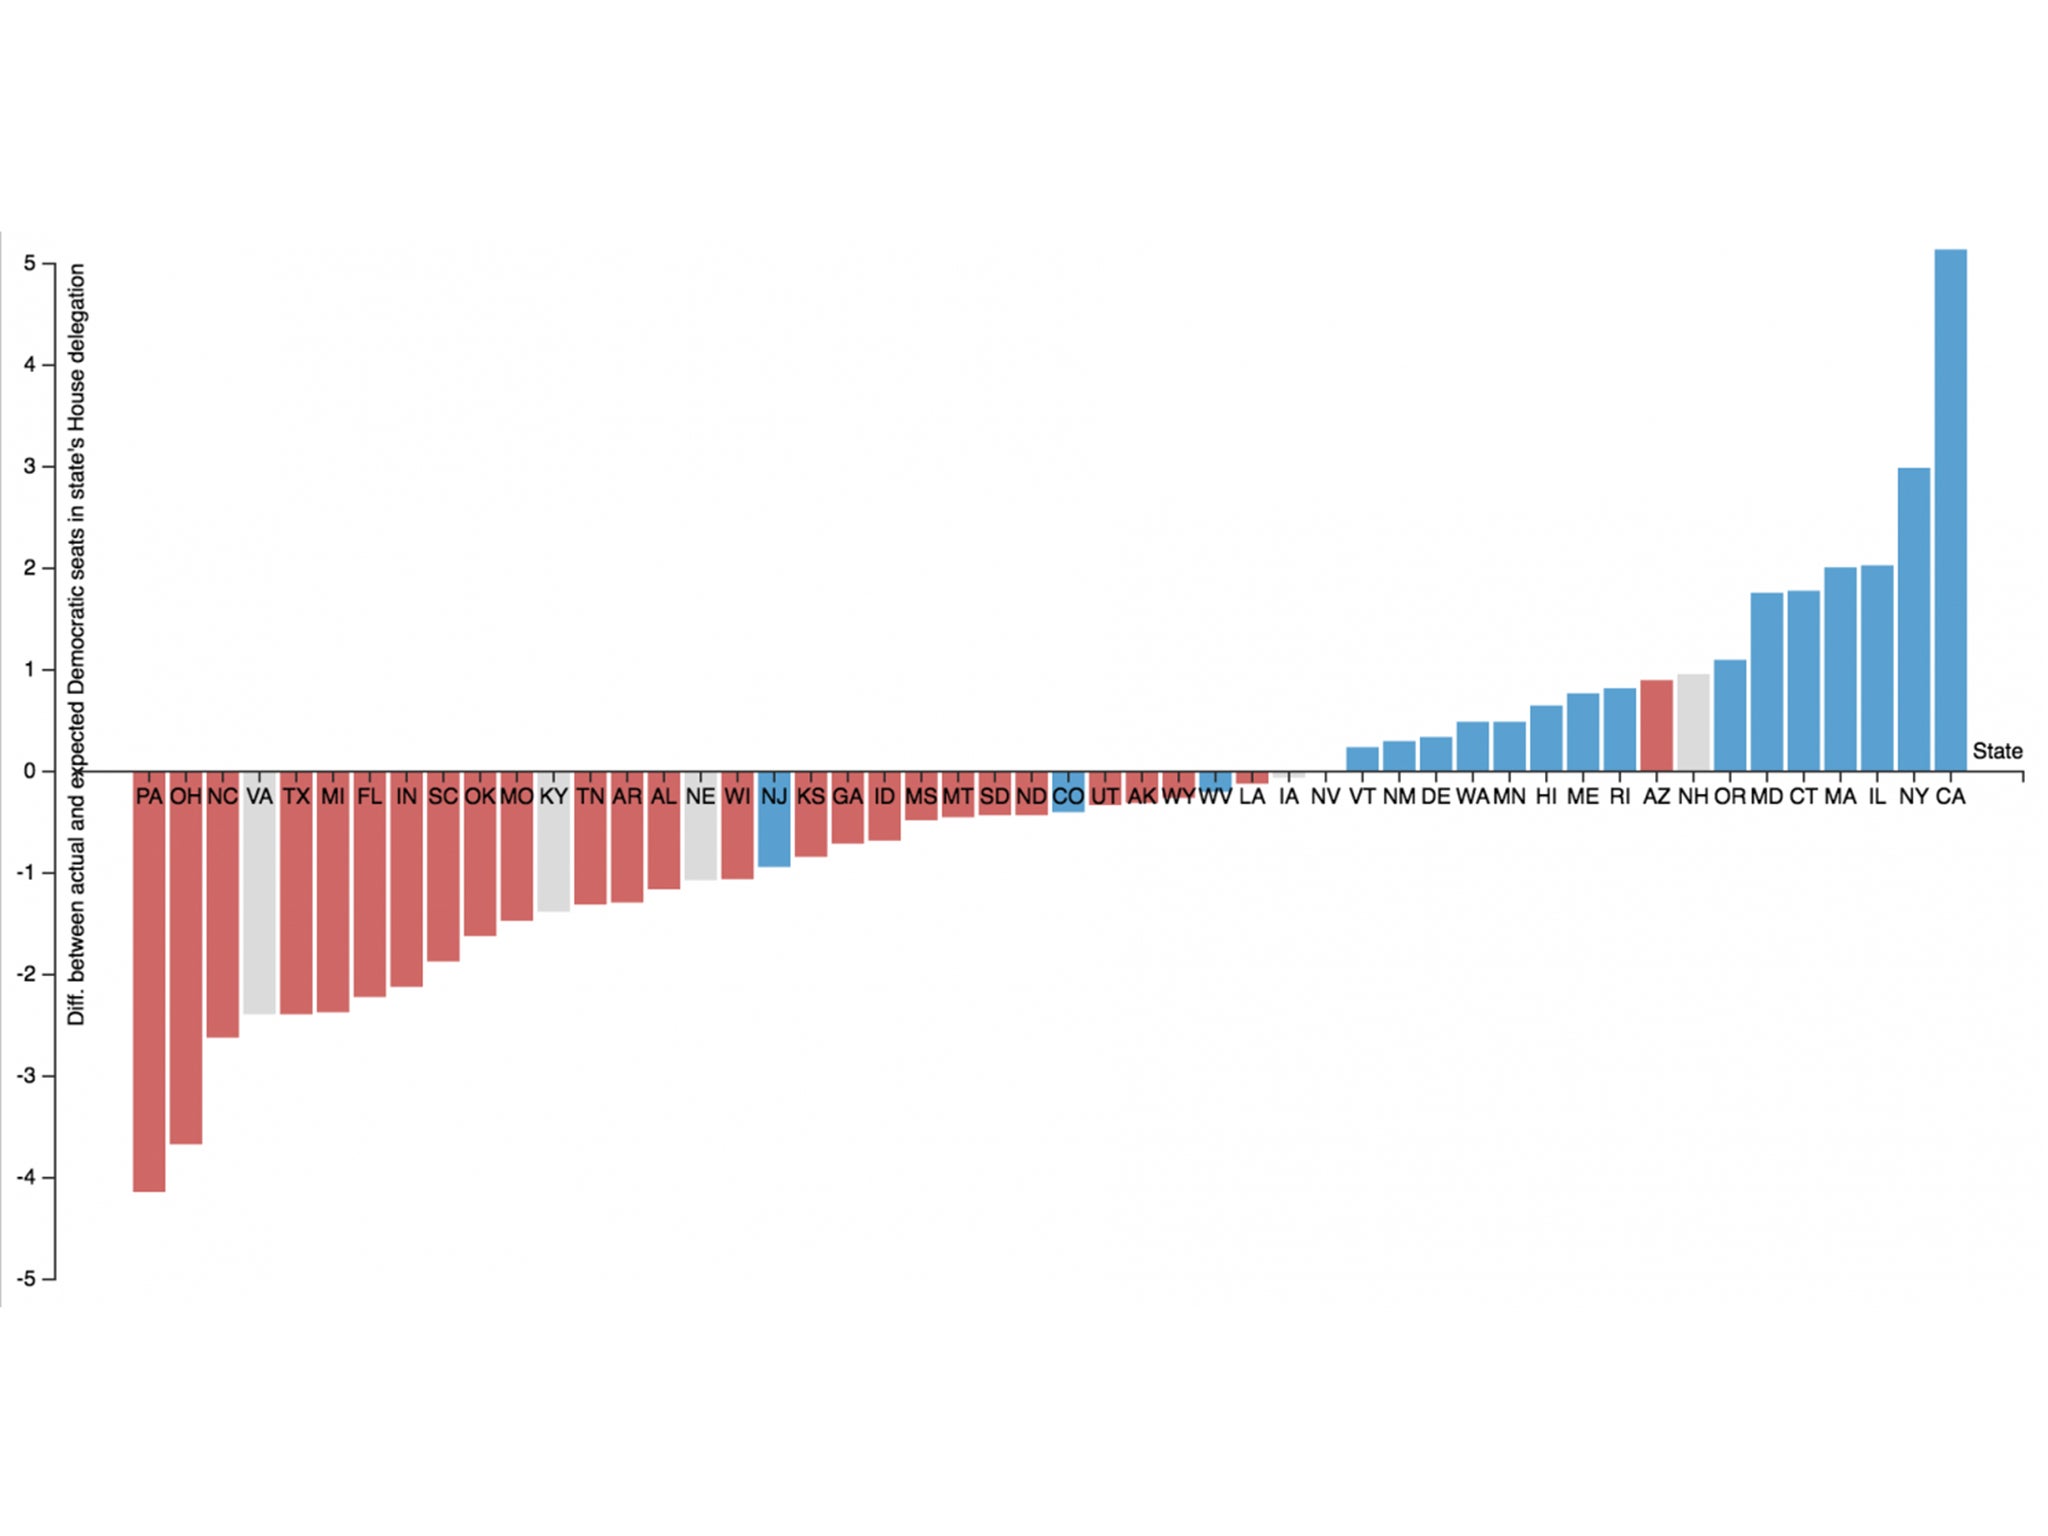
You can see the net effect of this in the chart below. For each state, it plots the difference between the actual and expected number of US House seats held by Democrats in each state, based on the share of the state's popular House vote that went to Democrats.
Negative values indicate states where Democrats ended up with a smaller percentage of seats than their statewide vote share would suggest. Positive values indicate a Democratic advantage relative to vote share. The colors of the bars represent whether Democrats (blue) or Republicans (red) controlled state government in 2012.

So in Pennsylvania, all the way on the left side of the chart, you can see that Democrats received 4 fewer seats in the House than their popular vote totals would suggest. In Pennsylvania, Democratic House candidates received a total of 51 percent of the popular House vote. But because of the way Pennsylvania's district's are drawn, Democrats only won five out of the state's 18 seats in the House.
You see similar Democratic disadvantages in places like Ohio, North Carolina, Texas and Michigan. Those states have one thing in common: They were all under the control of Republicans in 2012.
Gerrymandering isn't a one-way street, either. You can see on the right side of the chart, where boundaries drawn by Democratically controlled states yielded much larger seat totals than expected based on the popular vote numbers.
But overall, Republicans had the upper hand in redistricting efforts following the 2010 census. And the composition of the House in 2012 reflected that.
A cynic might call such an outcome “rigged.”
The 2014 House election was a different story. Democratic voters are less likely to turn out in midterm elections, giving Republicans a natural advantage. In 2014, Democratic House candidates received 45 percent of the overall vote and won about 43 percent of the seats. The overall composition of the House didn't change much.
One step toward fixing the issue would be to appoint independent commissions to redraw congressional districts, rather than letting the parties do it. Some western states do this already.
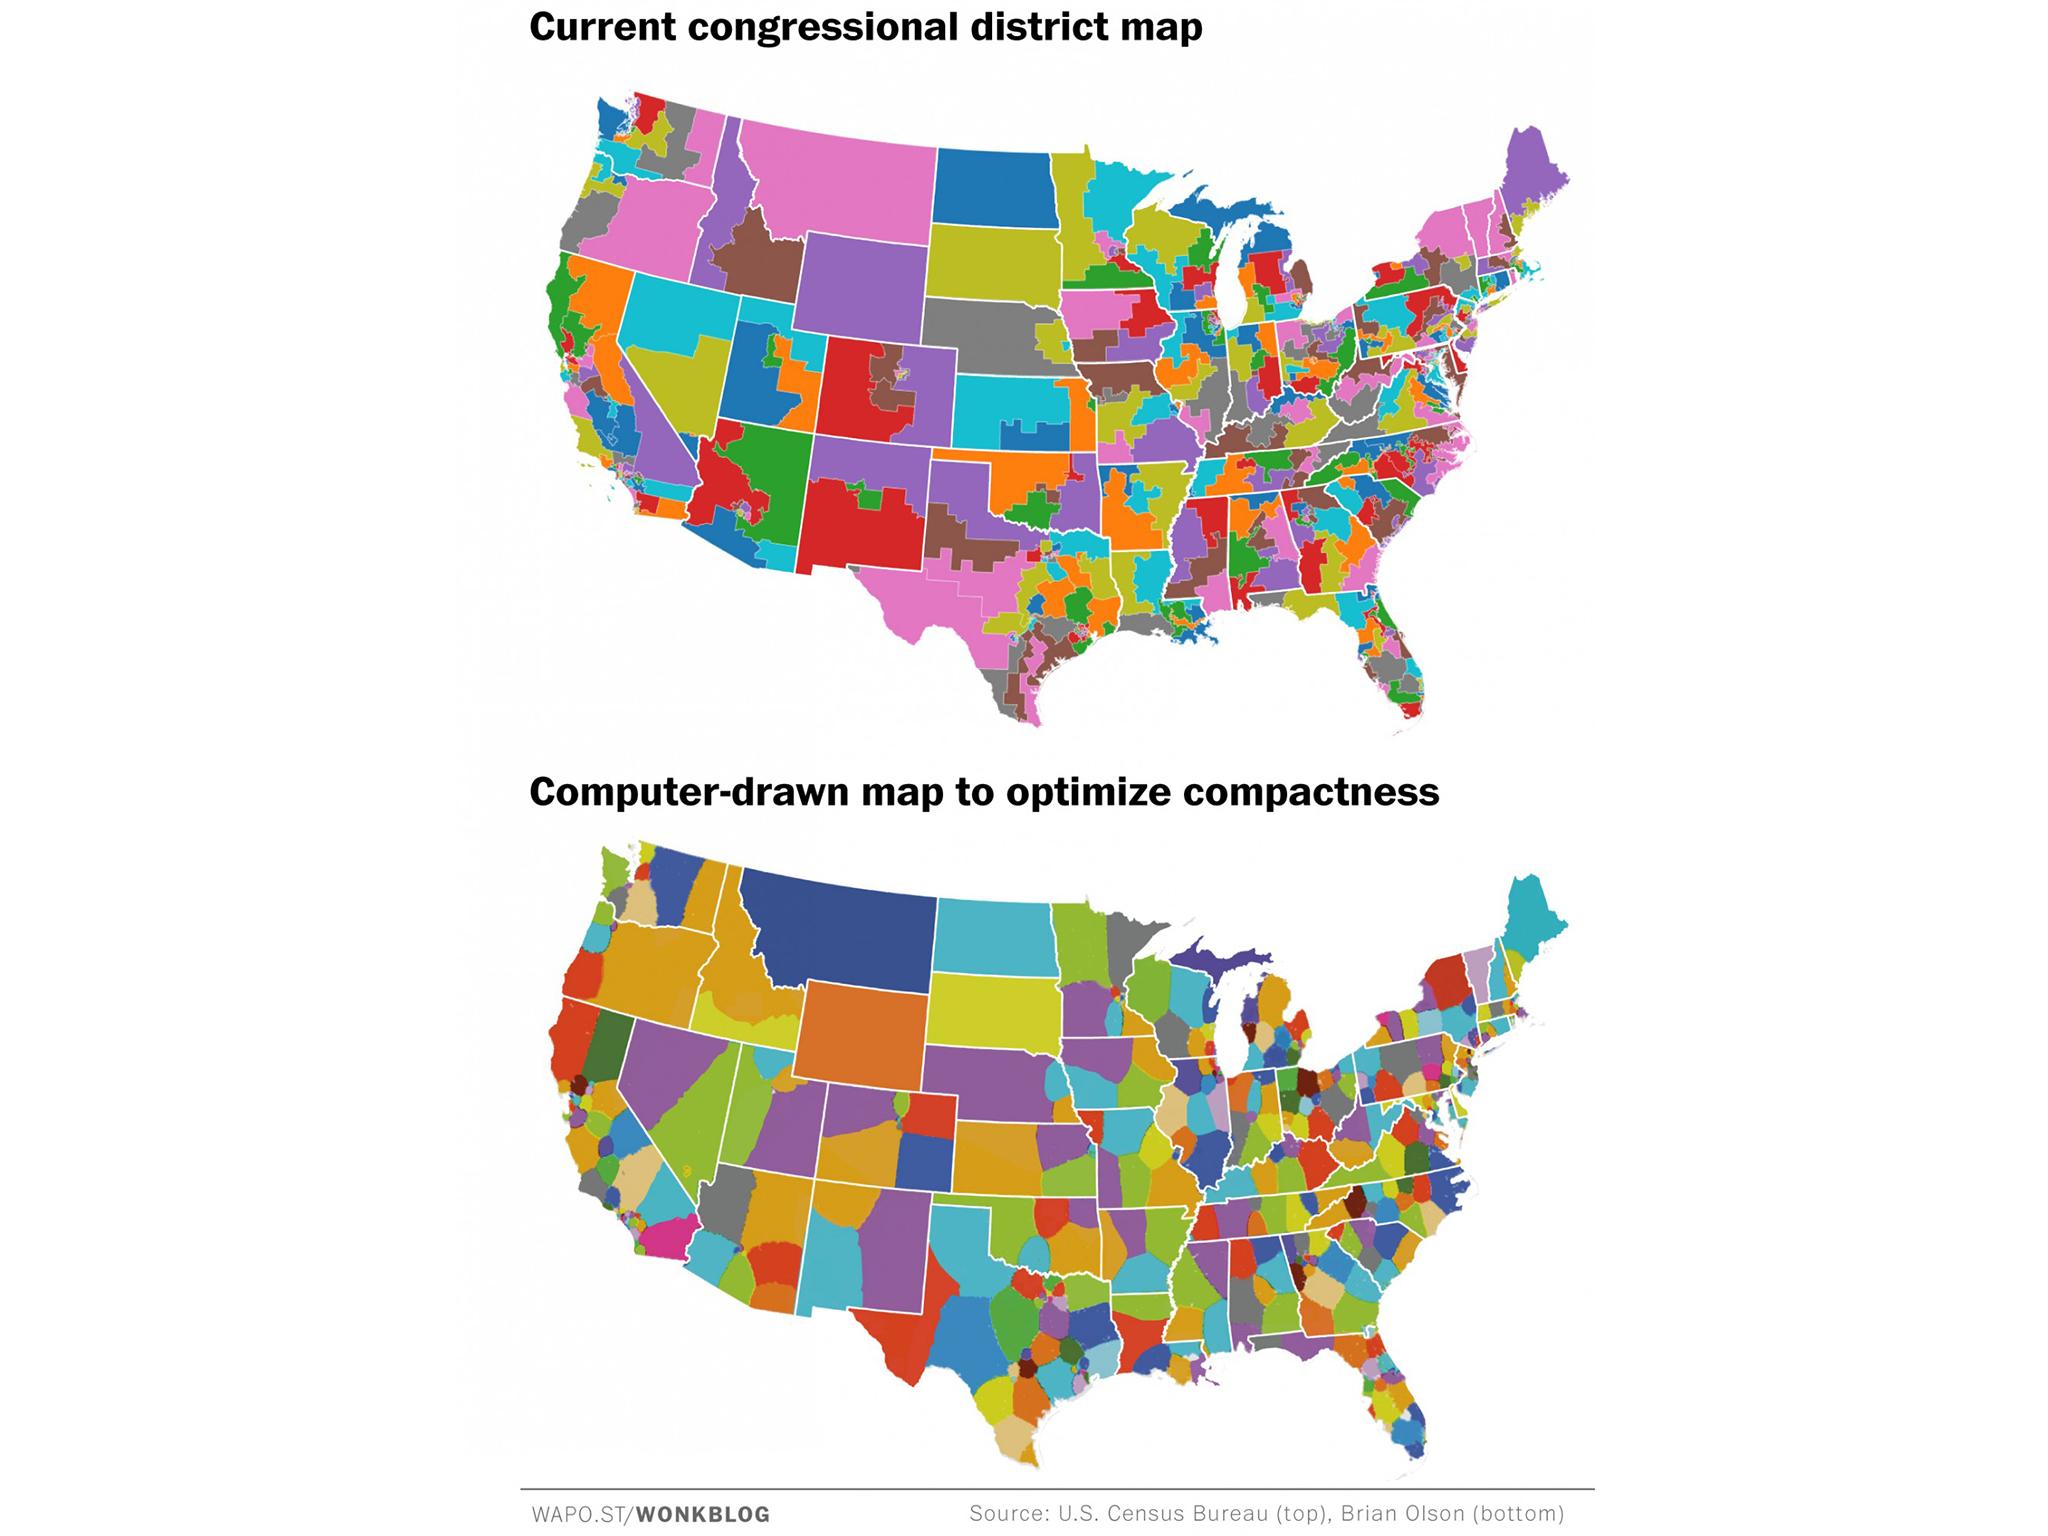
But independent commissions still leave the door open to human bias creeping in. An even better solution would be to hand the task of redistricting over to algorithms that can redraw equal-population districts according to simple and straightforward criteria, such as geographical compactness.

People have already worked out what this would look like. Compactness isn't a perfect metric, of course. Boundaries will always have to be drawn somewhere, and that somewhere could arbitrarily fall across a neighborhood, geographic area, or community of similarly minded individuals.
But our current redistricting system produces serpentine boundaries that are far more arbitrary and capricious. Even worse, they're often drawn with the express intent of favoring one political party over another.
Computer redistricting could, by definition, eliminate the all-too-human bias that often creeps into the process. That could go a long way toward restoring peoples' confidence that the system is working for them and that they are picking their legislators, rather than the other way around.
So yes, there is a very true sense in which certain election outcomes could be “rigged” this year. But not at all in the way Trump is suggesting.
The Washington Post
Join our commenting forum
Join thought-provoking conversations, follow other Independent readers and see their replies
Comments
Bookmark popover
Removed from bookmarks