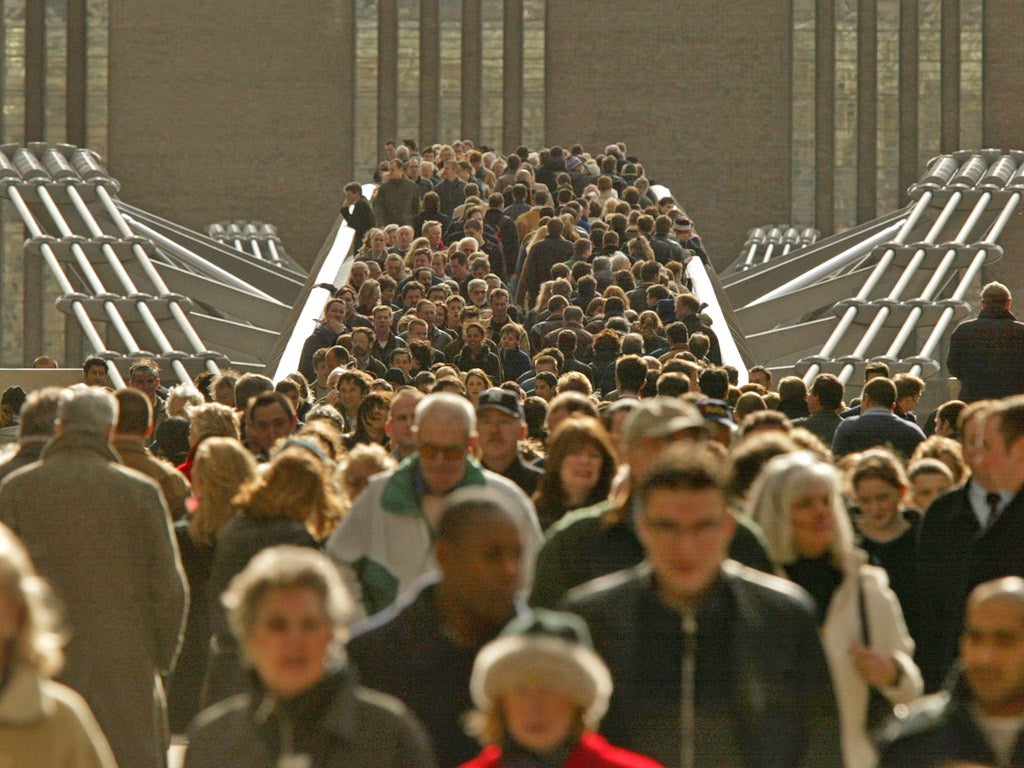
Less religious and more ethnically diverse: Census reveals a picture of Britain today
From the number of people going to church, to the number of children in the average household, a lot has changed in Britain since 2001. Charlotte Philby gets behind the numbers of the latest survey

Religion: Number of Christians down 12% in a decade
The number of people calling themselves Christian in the UK fell dramatically between 2001 and 2011. Christianity was the only religion to see a drop-off in membership, with a 12% decrease during those 10 years. The Methodist church described the results as “challenging but not discouraging” while the pioneering Christian group Fresh Expressions said “The church in England and Wales needs to find new ways of engaging those who no longer have, or never had any interest.”
The British Humanist Association spoke of a “significant cultural shift” in a society where “[r]eligious practice, identity, belonging and belief are all in decline… and non-religious identities are on the rise”. The number of people with no religion at all in the UK has doubled since 2001.
Islam showed the biggest growth in the country with 1.2 million – 5% of the population – calling themselves Muslims in 2011. That is up 1.8% in the past decade. Critics suggest this figure could be misleading, and in fact be a matter of more Muslims filling in the form properly. Birth rates among the Islamic community are not out of proportion with the rate of population increase.
Marriage: For the first time in history, a majority are unmarried
For the first time ever, the majority of Britons were unmarried in 2011. The percentage of married couples fell from 51 to 47%. Reasons for the decline include women outliving men, leaving an increased population of widows, as well as a greater number of younger couples choosing instead to cohabit.
As many as 35% of the population classed themselves as single at last count, that is an increase of 5% in 10 years. Fractured communities and, ironically, the communications revolution, are among those reasons for more solo living.
Married, Civil partnered and one-person households accounted for 63% (14.8m) of all households. Meanwhile the number of us living in shared accommodation has grown. In seven years since the Civil Partnership Act was introduced in 2004, the number of official same-sex unions had reached 105,000 by 2011.
Ethnicity: Indians beat Irish as top migrant group while melting pot grows
India had replaced the Republic of Ireland as the biggest migrant community, with Pakistan retaining third position. The success of immigrants including Rajesh Agrawal, 35, who arrived from India with £60, and is now a super-rich entrepreneur has highlighted flaws in changes in the law in the past decade. Had the immigration tick box system been in place when Agrawal came to the UK eight years ago, he wouldn’t have been allowed in.
Britain has proven an ever-warmer melting pot with 2.2% of the population in England and Wales calling themselves mixed race - up from 1.27% in 2001. According to the think tank British Future which produced ‘The Melting Pot Generation: How Britain became more relaxed about race’, the true figure is far higher: “Twice as many people have ethnically mixed parentage – but over half of them choose other census categories, such as black or white”.
Wales had the largest proportion of people who listed their ethnic group as White in 2011,that was 96% of the population. Compared to London where just 59% ticked White in 2011, and less than half of 8.2 million usual residents claimed to be White British. At the same time, Londoners are more likely to consider themselves “British” rather than “English”, leading commentators to report the dawning of a new cosmopolitan sense of ‘Britishness’ sweeping the Capital.
Population: There’s a lot more of us (and more of us were born elsewhere)
Of 56.1 million residents of England and Wales last year (that is 3.7m more than 10 years previously) some 7.5m were born abroad –that is 3m more than the number reported in 2001. Just under half of those had arrived in the past 10 years.
There are now 23.4 million households in the UK, with 2.4 residents per household. The number of these that are mortgages has dropped while the number of renters – most acutely in London where property prices were less affected by the property crisis – has risen in its place.
Census in numbers
14m people now consider themselves without a religion – up from 7.7m in 2001
The number of cars and vans in England and Wales rose to 23.9m
4.2m The number of people who work in the wholesale and retail sector – more than any other
Nearly 80% of people in England and Wales live in a whole house or bungalow, rather than a flat or apartment
96% of Welsh people are white, compared with just 59% of Londoners
The number of people claiming Jedi Knights as a religion fell by 50% to 176,632
Join our commenting forum
Join thought-provoking conversations, follow other Independent readers and see their replies
Comments
Bookmark popover
Removed from bookmarks