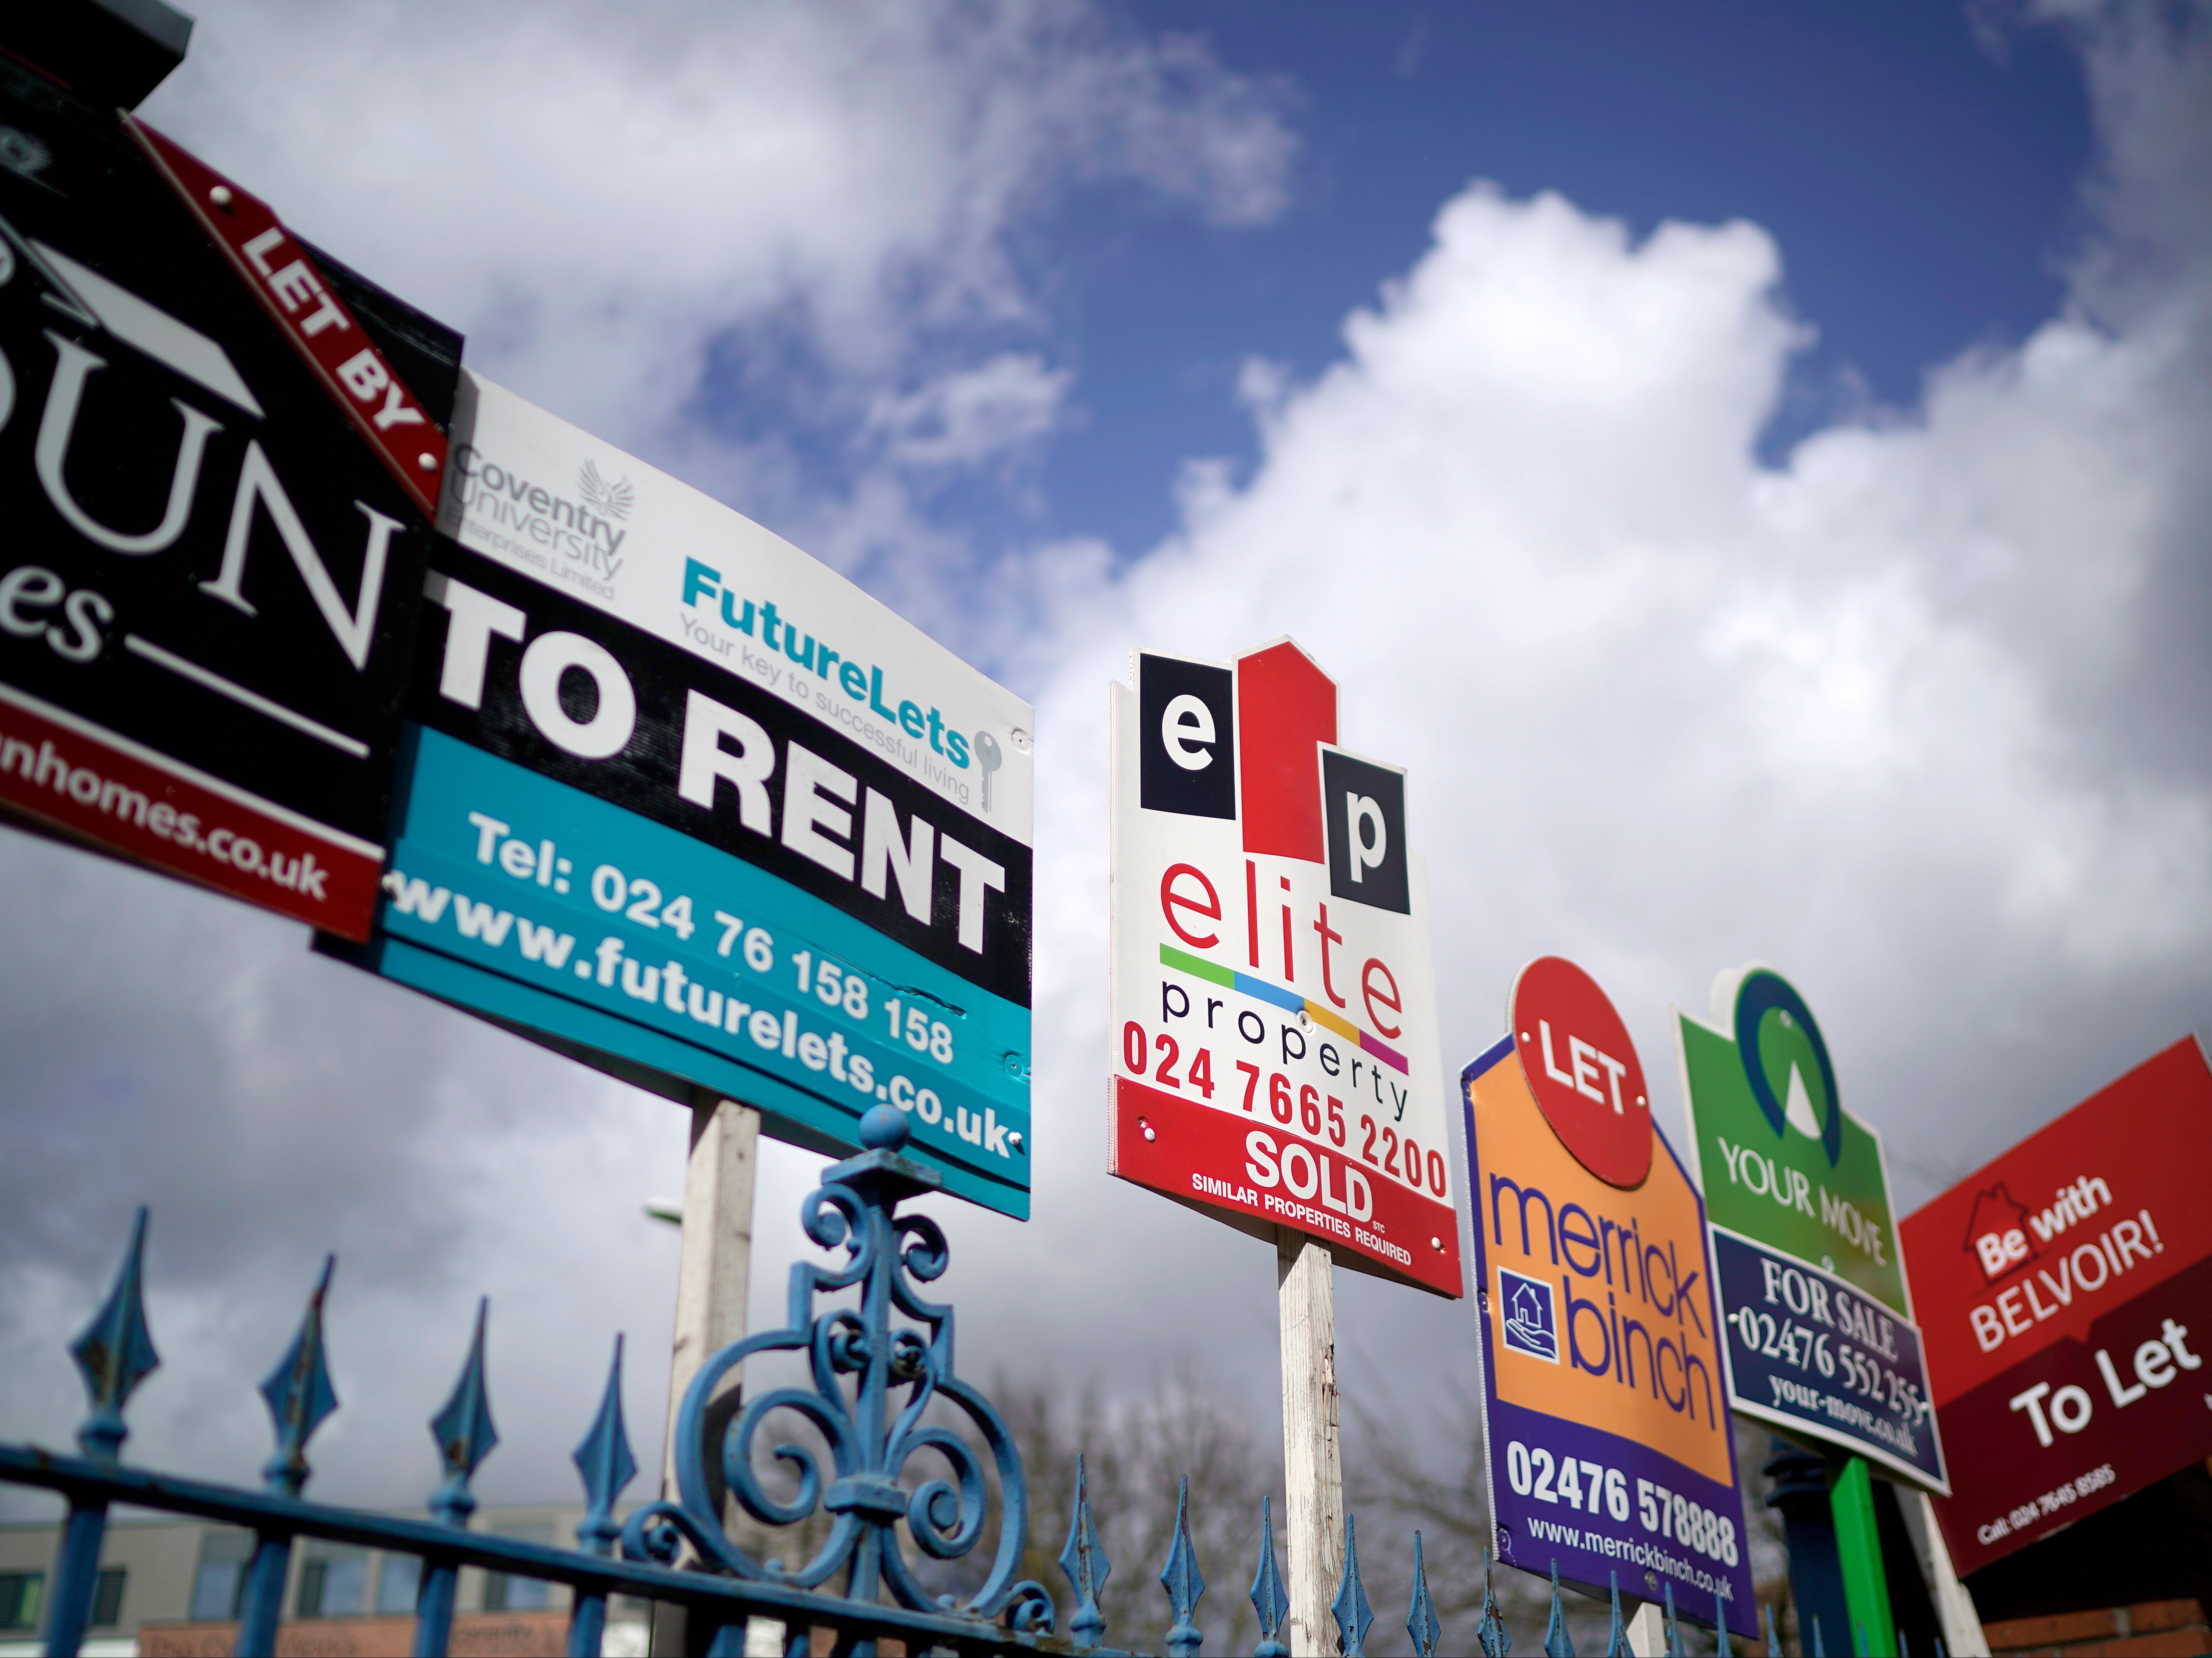
Mapped: House prices by area amid biggest fall in 14 years
London sees lowest growth of any part of UK, as slowdown also hits Wales and South West in particular

Your support helps us to tell the story
From reproductive rights to climate change to Big Tech, The Independent is on the ground when the story is developing. Whether it's investigating the financials of Elon Musk's pro-Trump PAC or producing our latest documentary, 'The A Word', which shines a light on the American women fighting for reproductive rights, we know how important it is to parse out the facts from the messaging.
At such a critical moment in US history, we need reporters on the ground. Your donation allows us to keep sending journalists to speak to both sides of the story.
The Independent is trusted by Americans across the entire political spectrum. And unlike many other quality news outlets, we choose not to lock Americans out of our reporting and analysis with paywalls. We believe quality journalism should be available to everyone, paid for by those who can afford it.
Your support makes all the difference.The UK housing market has experienced its largest monthly fall in prices since the financial crash in 2008, according to Halifax.
The average UK house price in November was £285,579 – a fall of some 2.3 per cent on the previous month.
While prices are still significantly higher than they were a year ago, they have now fallen for three consecutive months, according to Halifax.
The most recent drop has therefore slowed annual house price growth to 4.7 per cent, down from 8.2 per cent in October.
Mortgage rates leapt following the disastrous September mini-Budget which forced Liz Truss’s historically early exit from No 10, with the Bank of England’s base rate rises also pushing up borrowing costs, as household incomes are squeezed by levels of inflation not seen since the 1980s.
Property prices are still up by more than £12,000 comapared with last year, according to Kim Kinnaird, director of Halifax Mortgages. Prices are also sitting well above pre-pandemic levels, having gone up by £46,403 compared with March 2020.
“While a market slowdown was expected given the known economic headwinds – and following such extensive house price inflation over the last few years (19 per cent growth since March 2020) – this month’s fall reflects the worst of the market volatility over recent months,” said Ms Kinnaird.
“The market may now be going through a process of normalisation.,” she said, adding that some potential home moves have been paused as buyers feel increased pressure over the affordability of properties and mortgages.
Unsurprisingly, the slowdown in house prices has been different across the UK, and has been felt most acutely in Wales and the southwest of England, according to Halifax.
Both were key hotspots of house price inflation during the coronavirus pandemic – which suggests that previous drivers of the market such as the “race for space” and heightened demand for rural living are now receding, Halifax said.
The pace of annual property price inflation also slowed in London, which continues to lag behind other UK regions and nations at a rate of 5.2 per cent – however the average price in London remains well above the UK average at £549,160.
The largest growth, conversely was seen in England’s North East, where prices rose by 10.5 per cent but remained the lowest in the UK, with an average of £173,587.
Here are the average house prices in your area and the annual increases witnessed in the 12 months to November, according to Halifax:
- East Midlands – £244,429 – 9.5 per cent
- Eastern England – £339,683 – 7.3 per cent
- London – £549,160 – 5.2 per cent
- North East – £173,587 – 10.5 per cent
- North West – £229,218 – 9.4 per cent
- Northern Ireland – £185,097 – 9.1 per cent
- Scotland – £203,132 – 6.5 per cent
- South East – £397,562 – 7.6 per cent
- South West – £307,750 – 8.4 per cent
- Wales – £220,689 – 7.9 per cent
- West Midlands – £253,253 – 9.4 per cent
- Yorkshire and the Humber – £207,800 – 9.3 per cent


Join our commenting forum
Join thought-provoking conversations, follow other Independent readers and see their replies
Comments