Britain's burglary hotspots revealed: London, Manchester and Yorkshire postcodes top list
Insurance claims rather than crime figures were analysed for the research

Your support helps us to tell the story
From reproductive rights to climate change to Big Tech, The Independent is on the ground when the story is developing. Whether it's investigating the financials of Elon Musk's pro-Trump PAC or producing our latest documentary, 'The A Word', which shines a light on the American women fighting for reproductive rights, we know how important it is to parse out the facts from the messaging.
At such a critical moment in US history, we need reporters on the ground. Your donation allows us to keep sending journalists to speak to both sides of the story.
The Independent is trusted by Americans across the entire political spectrum. And unlike many other quality news outlets, we choose not to lock Americans out of our reporting and analysis with paywalls. We believe quality journalism should be available to everyone, paid for by those who can afford it.
Your support makes all the difference.Parts of east London, Manchester and South Yorkshire are among the worst hotspots for burglary in the UK, according to analysis of insurance claims.
Seven London postcodes appeared in the top 10 compiled by MoneySupermarket in its annual Burglary Claims Tracker.
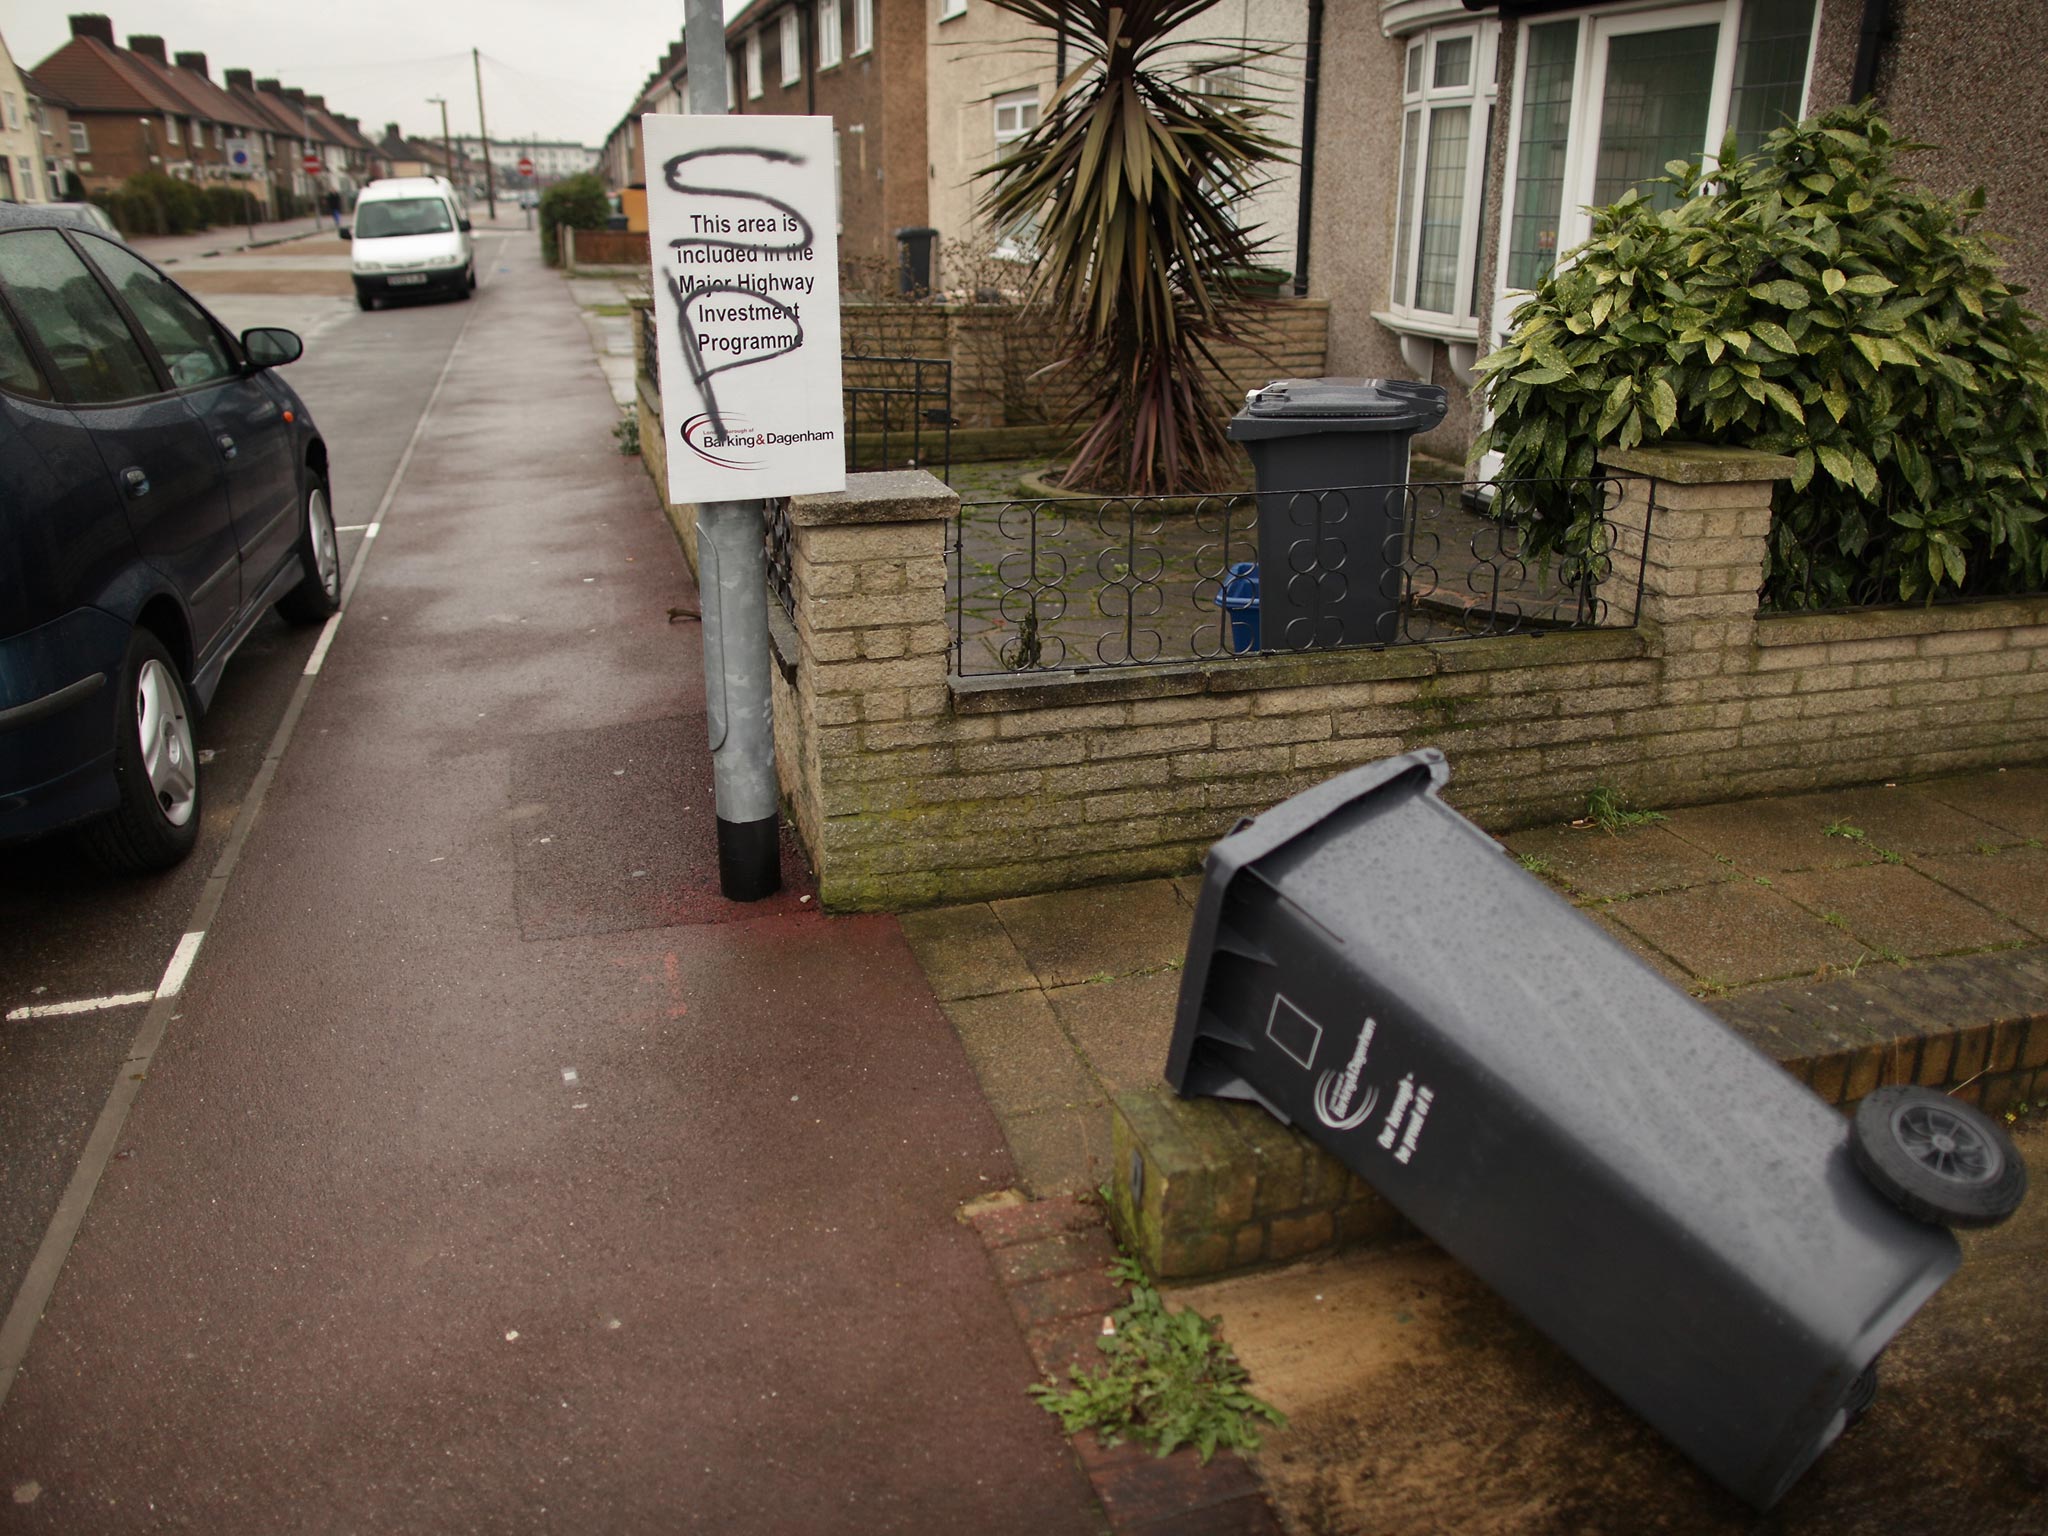
The highest rate of claims in 2014 was found in London’s RM8 postcode, which saw 55 claims per 1,000 people. It includes Dagenham and Becontree, followed by nearby IG2 incorporating the areas of Gants Hill and Newbury Park, near Ilford.
Last year’s worst areas of Chorlton-cum-Hardy and Barlow Moor, in M21, came in third place with 52 claims per 1,000 enquiries – up on last year.
The Manchester suburbs were closely followed by parts of Doncaster (DN2) and Woodford and South Woodford in east London (E18), both with a burglary claims rate of 48.

A spokesperson for the Metropolitan Police emphasised that the ranking was based on insurance claims rather than official crime statistics.
The force’s own figures put Redbridge as the worst London borough for burglary last month. It includes much of the IG2, E18, IG3 and IG8 postcodes in the top 20 hotspots.
There were 307 burglaries in the borough in December – averaging at almost 10 every day.

Cardiff North East topped the Welsh list, while the EH14 postcode area including Balerno, Currie, Edinburgh and Juniper Green topped the Scottish list.
Several areas were found to have no burglary claims at all in 2014, in Scotland, north Wales and Suffolk.
Dundee, Dumfries, Dunbartonshire, Felixstowe and Bangor are among the safest places to be, according to the figures.
MoneySupermarket analysed 2.7 million home insurance quotes for the research to identify the areas most likely to have been hit.
A spokesperson for the website said: “Outside of financial loss, supporting research shows that burglary has a lasting impact on people's lives - one in eight burglary victims never recover emotionally and one in four in four struggle to replace stolen items.”
Top 20 burglary claim hotspots
1. RM8 Dagenham, Becontree, Becontree Heath Rate: 55.0
2. IG2 Gants Hill, Newbury Park, Aldborough Hatch (Ilford) Rate: 54.9
3. M21 Chorlton-cum-Hardy, Barlow Moor Rate: 51.8
4. DN2 Intake, Wheatley, Wheatley Hills Rate: 48.3
5. E18 Woodford and South Woodford Rate: 48.2
6. RM11 Hornchurch, Emerson Park, Ardleigh Green Rate: 47.1
7. TW11 Teddington, Fulwell (east), Bushy Park Rate: 47.1
8. BD2 Eccleshill, Five Lane Ends, parts of Undercliffe, Fagley, Wrose, Bolton Woods, Poplars Farm, Swain House, Ashbourne Rate: 46.9
9. EN4 Hadley Wood, Cockfosters, East Barnet, New Barnet Rate: 45.5
10. IG3 Seven Kings, Goodmayes, Hainault Rate: 44.0
11. BD18 Saltaire, Shipley, Windhill, Wrose Rate:43.6
12. W4 Chiswick, Gunnersbury, Turnham Green, Acton Green, Bedford Park Rate: 43.0
13. TW5 Heston, North Cranford, West Osterley Rate: 42.9
14. IG8 Woodford Green, Woodford Bridge, Highams Park Rate: 42.5
15. LS28 Bagley, Calverley, Farsley, Pudsey, Stanningley (Pudsey) Rate: 42.2
16. BR5 West Wickham Rate: 42.1
17. UB6 Greenford, Perivale Rate: 41.9
18. UB4 North Hayes, Yeading Rate: 41.6
19. N11 New Southgate, Friern Barnet, Bounds Green, Arnos Grove Rate: 41.1
20. LS15 Austhorpe, Barwick-in-Elmet, Colton, Cross Gates, Halton, Halton Moor, Manston, Pendas Fields, Scholes, Temple Newsam, Whitkirk Rate: 40.8
Join our commenting forum
Join thought-provoking conversations, follow other Independent readers and see their replies
Comments