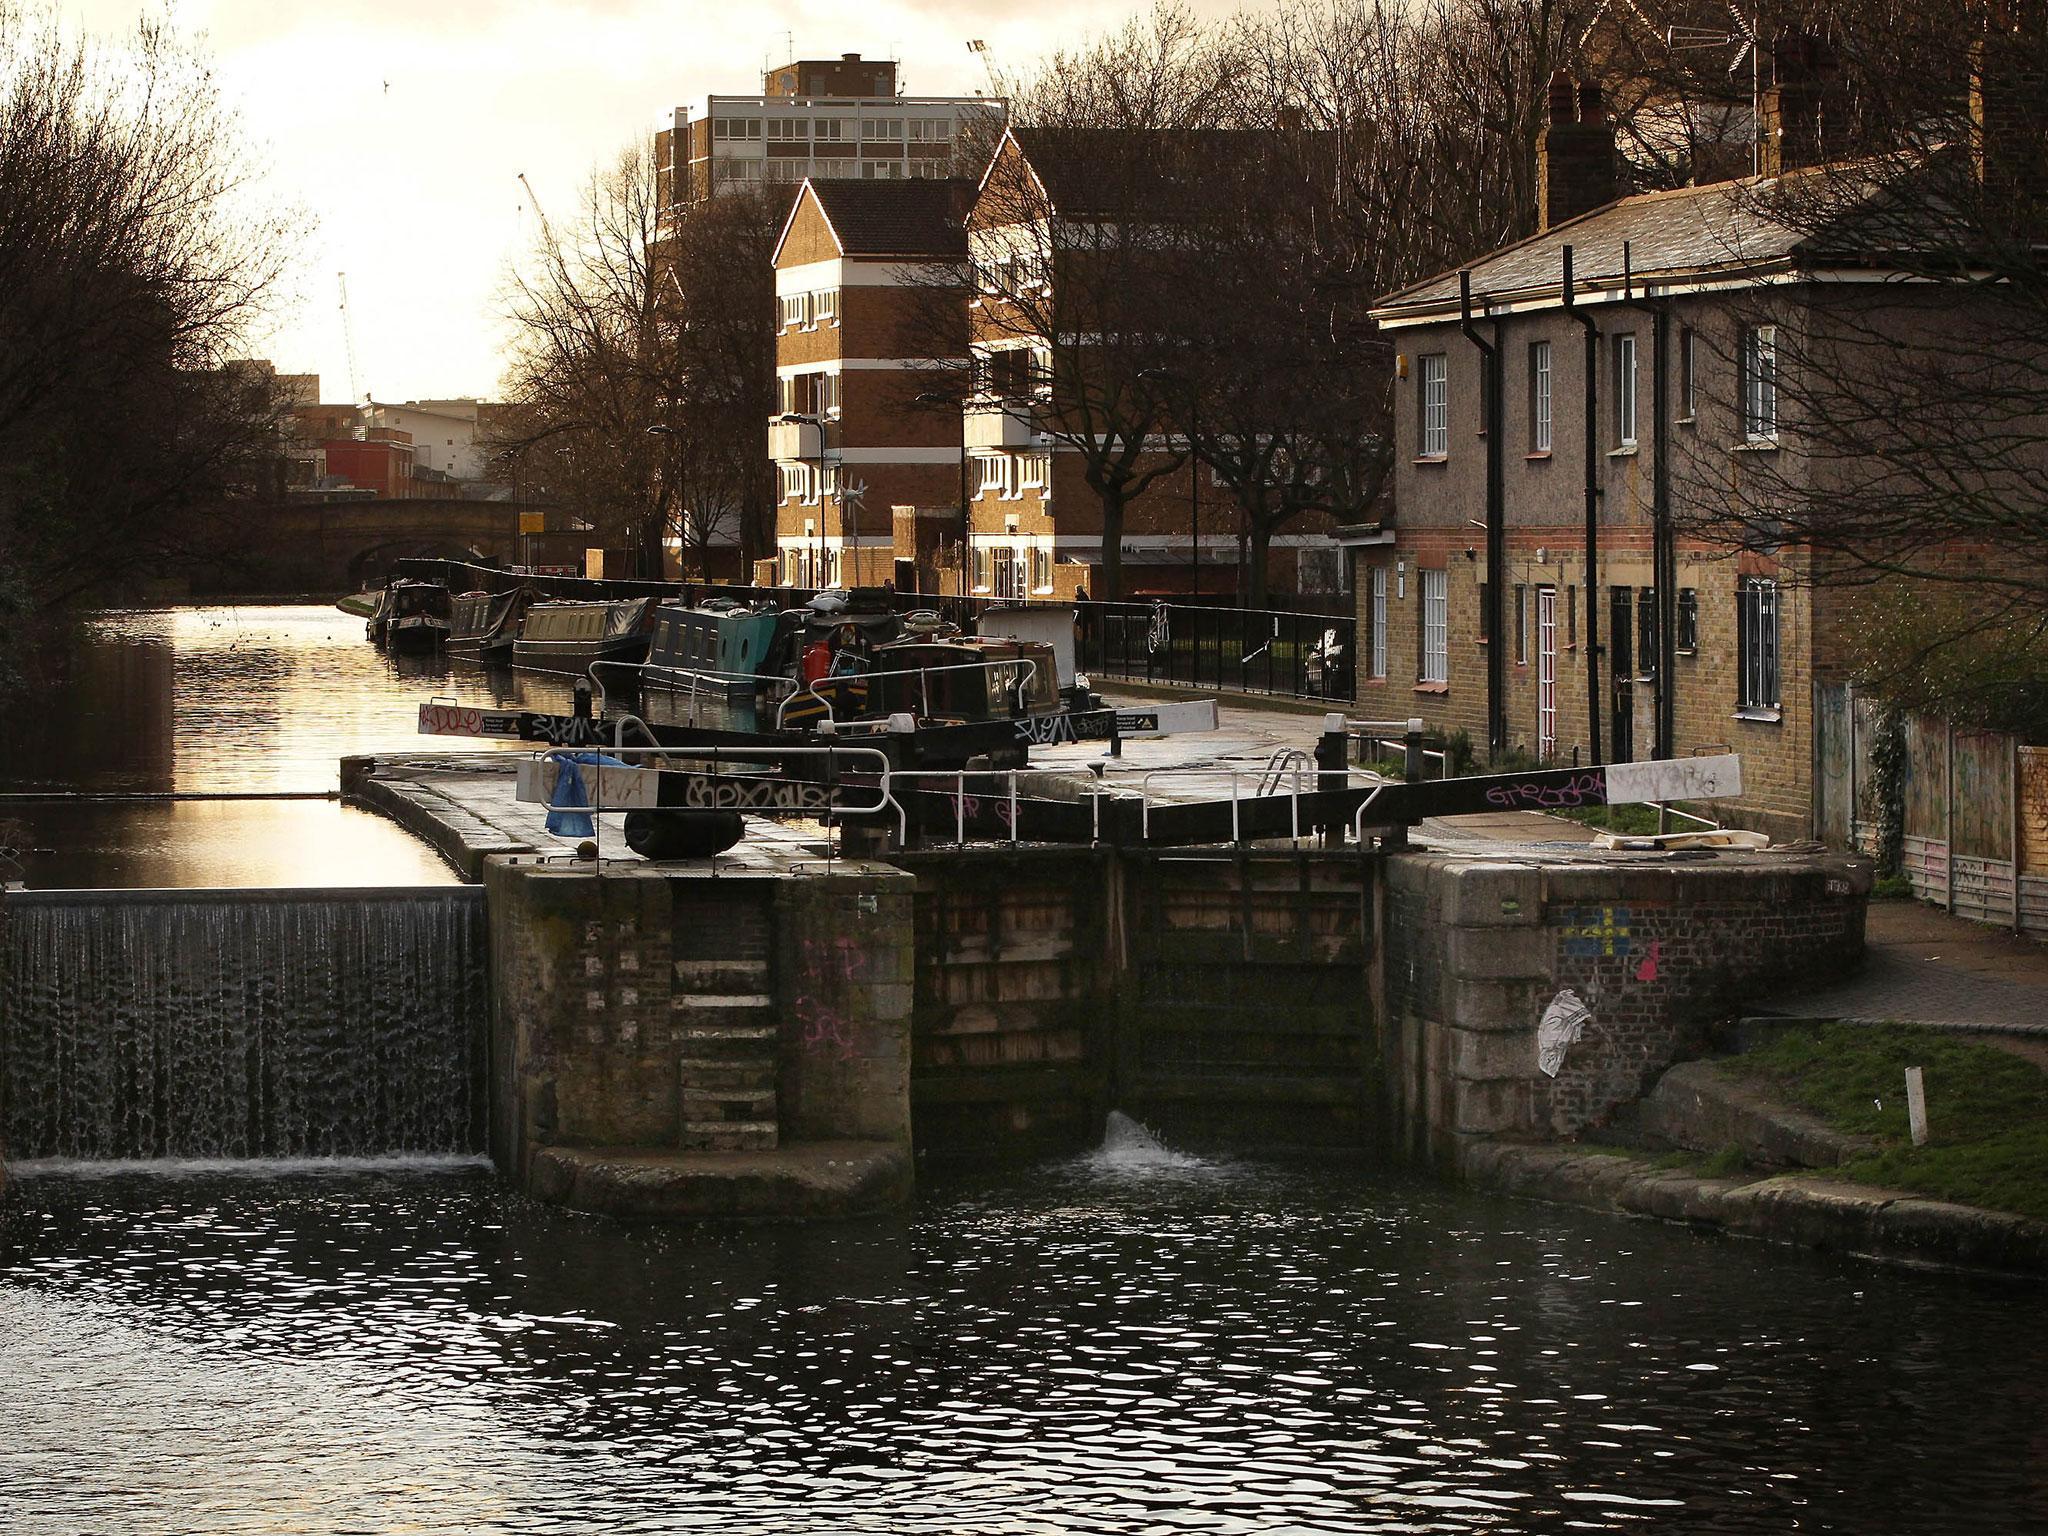
Hackney homes are most expensive in UK relative to average wages
In the north-east London borough, the average annual wage is £33,800 and the average house price is a lofty £575,511 – equating to a ratio of 17.03

Your support helps us to tell the story
From reproductive rights to climate change to Big Tech, The Independent is on the ground when the story is developing. Whether it's investigating the financials of Elon Musk's pro-Trump PAC or producing our latest documentary, 'The A Word', which shines a light on the American women fighting for reproductive rights, we know how important it is to parse out the facts from the messaging.
At such a critical moment in US history, we need reporters on the ground. Your donation allows us to keep sending journalists to speak to both sides of the story.
The Independent is trusted by Americans across the entire political spectrum. And unlike many other quality news outlets, we choose not to lock Americans out of our reporting and analysis with paywalls. We believe quality journalism should be available to everyone, paid for by those who can afford it.
Your support makes all the difference.If you’re thinking of buying a house in the London Borough of Hackney, you might be paying more than anywhere else in the country relative to your average wage.
According to new research, the average house price across the UK is now more than six times that of the average wage, with a gap of £6,111 between the current average wage and the wage required for a general mortgage approval of four and a half times your salary.
But in Hackney, the average annual wage is £33,800 and the average house price is a lofty £575,511 – equating to a ratio of 17.03 and making it the most expensive place to buy property relative to income.
The London Borough of Brent is the second priciest area based on that metric, according to the research compiled by estate agent emoov.co.uk, ahead of Haringey, Waltham Forest, Ealing, Harrow and Barnet.
The only area in the top ten that does not fall within London is Purbeck in Dorset, in eighth spot, where the average salary is £23,800 and the average house price £335,950, putting its ratio at 14.12.
Ham & Fulham and Newnham are in ninth and tenth spot respectively.
At the other end of the spectrum, at 3.43, the house price to wage ratio is lowest in Burnley, where the average wage is £23,500 a year and the average house goes for £80,605.
Overall, the ratio in London is 12.05, putting it top of the UK in a ranking of regions, ahead of the South West, at 9.55, the South East, at 9.50 and the East, at 9.33.
The average for the whole of England stands at 7.86, ahead of Wales, at 5.95, Scotland at 5.07 and Northern Ireland at 5.32.
Join our commenting forum
Join thought-provoking conversations, follow other Independent readers and see their replies
Comments