David Blanchflower: Claims made by the Chancellor three weeks ago are already in tatters
Data on Economic Well-Being shows the UK economy is not going to be the electoral asset the Tories hoped

Your support helps us to tell the story
From reproductive rights to climate change to Big Tech, The Independent is on the ground when the story is developing. Whether it's investigating the financials of Elon Musk's pro-Trump PAC or producing our latest documentary, 'The A Word', which shines a light on the American women fighting for reproductive rights, we know how important it is to parse out the facts from the messaging.
At such a critical moment in US history, we need reporters on the ground. Your donation allows us to keep sending journalists to speak to both sides of the story.
The Independent is trusted by Americans across the entire political spectrum. And unlike many other quality news outlets, we choose not to lock Americans out of our reporting and analysis with paywalls. We believe quality journalism should be available to everyone, paid for by those who can afford it.
Your support makes all the difference.Three weeks is a long time in economics. In his Autumn Statement on 3 December, the Chancellor presented “a forecast that shows the UK is the fastest-growing of any major advanced economy in the world”. He boasted: “A year ago, we expected GDP to grow by 2.4 per cent. In March we expected 2.7 per cent. Today, the British economy is forecast to grow by 3 per cent… And the growth we are now seeing is more balanced. Manufacturing is growing faster than any other sector; and investment is set to be up 11 per cent this year.”
Now all of those claims are in tatters. First, there were the data revisions to GDP. Growth in the most recent quarter was left unrevised at 0.7 per cent, but growth in each of the previous three quarters was revised down by 0.1 per cent, and the two before that were revised down by 0.2 per cent each. For the Chancellor’s claim that growth in 2014 will be 3 per cent to be true, it requires growth in the fourth quarter of 2.2 per cent, which, of course, won’t happen. So bang goes that claim.
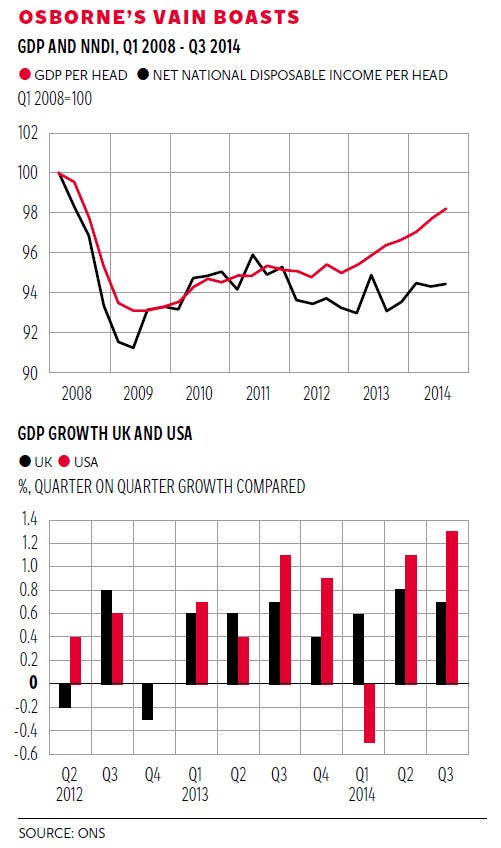
But there was worse, because on the same day as the downward GDP revisions for the UK there were upward revisions in the US to an annualised 5 per cent, or 1.25 per cent, in the third quarter. Another Osborne claim in the dustbin, as the first chart illustrates. Over the last five quarters the US grew faster in four; and two of the last two. Over the last five quarters the US had three with growth of over 1 per cent, while the UK had none. The ONS has now confirmed that the UK is not the fastest-growing advanced country. Those damn revisions will get you every time.
Manufacturing growth has slowed sharply, down from 1.1 per cent in the first quarter of 2014, to 0.5 per cent in Q2, to 0.3 per cent in Q3. Services grew by 0.8 per cent, so manufacturing isn’t growing faster than any other sector.
There were also downward revisions to business investment. The trade balance deficit widened from £10.9bn in Q2 2014 to £11.8bn in Q3 2014, and as a result the UK’s current account was in deficit by £27bn in the July to September quarter. At 6 per cent of gross domestic product, the current account deficit is now higher than it was at the end of the 1980s, its previous peak. The remaining three of the Chancellor’s boasts bite the dust.

The ONS also released new data on Economic Well-being, which suggested that the UK economy is not going to be the electoral asset the Tories had hoped. The ONS presented evidence on three other indicators for Q3 2014, two of which are plotted in the second chart. First, GDP per head increased 0.6 per cent compared to Q2 2014. This is lower than the 0.7 per cent growth in GDP because of population increase. GDP per head remains 1.8 per cent below pre-economic downturn levels. Second, Net National Disposable Income (NNDI) per head, which represents the income for UK residents, has remained broadly flat since Q1 2012 and is still 5.6 per cent below pre-economic downturn levels.
The ONS notes that not all income generated by production in the UK will be payable to UK residents. Some of the capital employed will be owned by non-residents, and they will be entitled to the return on that investment. Conversely, the UK’s residents receive income from production activities taking place elsewhere, based on their investments overseas. Adjusting for these flows gives a measure which is better focused on income, rather than production.
Second, it can be adjusted for capital consumption. GDP is “gross” in the sense that it does not adjust for capital depreciation – that is to say, the day-to-day wear and tear on vehicles, machinery, buildings and other fixed capital used in the productive process. It treats such consumption of capital as no different from any other form of consumption. But as the ONS rightly notes, most people would not regard depreciation as adding to their material well-being. Hence the need for NNDI.
Third, in Q3 2014, household income (RHDI) per head decreased 0.2 per cent on the quarter. Fourth, in Q3 2014 real household spending per head grew 0.8 per cent compared to the previous quarter. It remains 3.1 per cent below its pre-economic downturn levels. This is despite real household incomes per head remaining broadly around their pre-economic downturn levels. Fifth, the ONS also provided data for 2012/13, which is the most recent data available, for median income, which fell 1.4 per cent compared to 2011/12, to £23,300, its lowest level since 2002/03. Sixth, between 2011/12 and 2012/13, the ONS noted that there was a slight increase in income inequality. When the ratio of total income received by the richest fifth of households to that received by the poorest fifth is examined, it turns out that between 2011/12 and 2012/13 this ratio saw a small increase from 5.1 to 5.3, suggesting a slight increase in income inequality. The ONS suggests there were two reasons for the increase in this ratio: the income of the poorest fifth declined by 3.3 per cent; in addition the income of the richest fifth increased by 1.6 per cent. This is contrary to the trend seen between 2007/08 and 2011/12, which saw continued decreases in the ratio.
So the UK isn’t the fastest-growing advanced economy. Manufacturing isn’t growing faster than any other sector, and business investment is falling. The current account deficit is larger than it has been for 30 years. There is absolutely no evidence of any rebalancing to exports or manufacturing. GDP per capita still hasn’t returned to pre-recession levels, and inequality is rising.
So much for entering the general election with a nicely booming economy and rising living standards. Robert Burns was right: “the best laid schemes of mice and men, often go awry”.
Join our commenting forum
Join thought-provoking conversations, follow other Independent readers and see their replies
Comments