A viral march across the planet, tracked by a map in motion

On a Thursday night in early January, the disease that would become known as COVID-19 claimed its first victim a 61-year-old man who succumbed to the newly identified coronavirus in the city of Wuhan, in the People’s Republic of China.
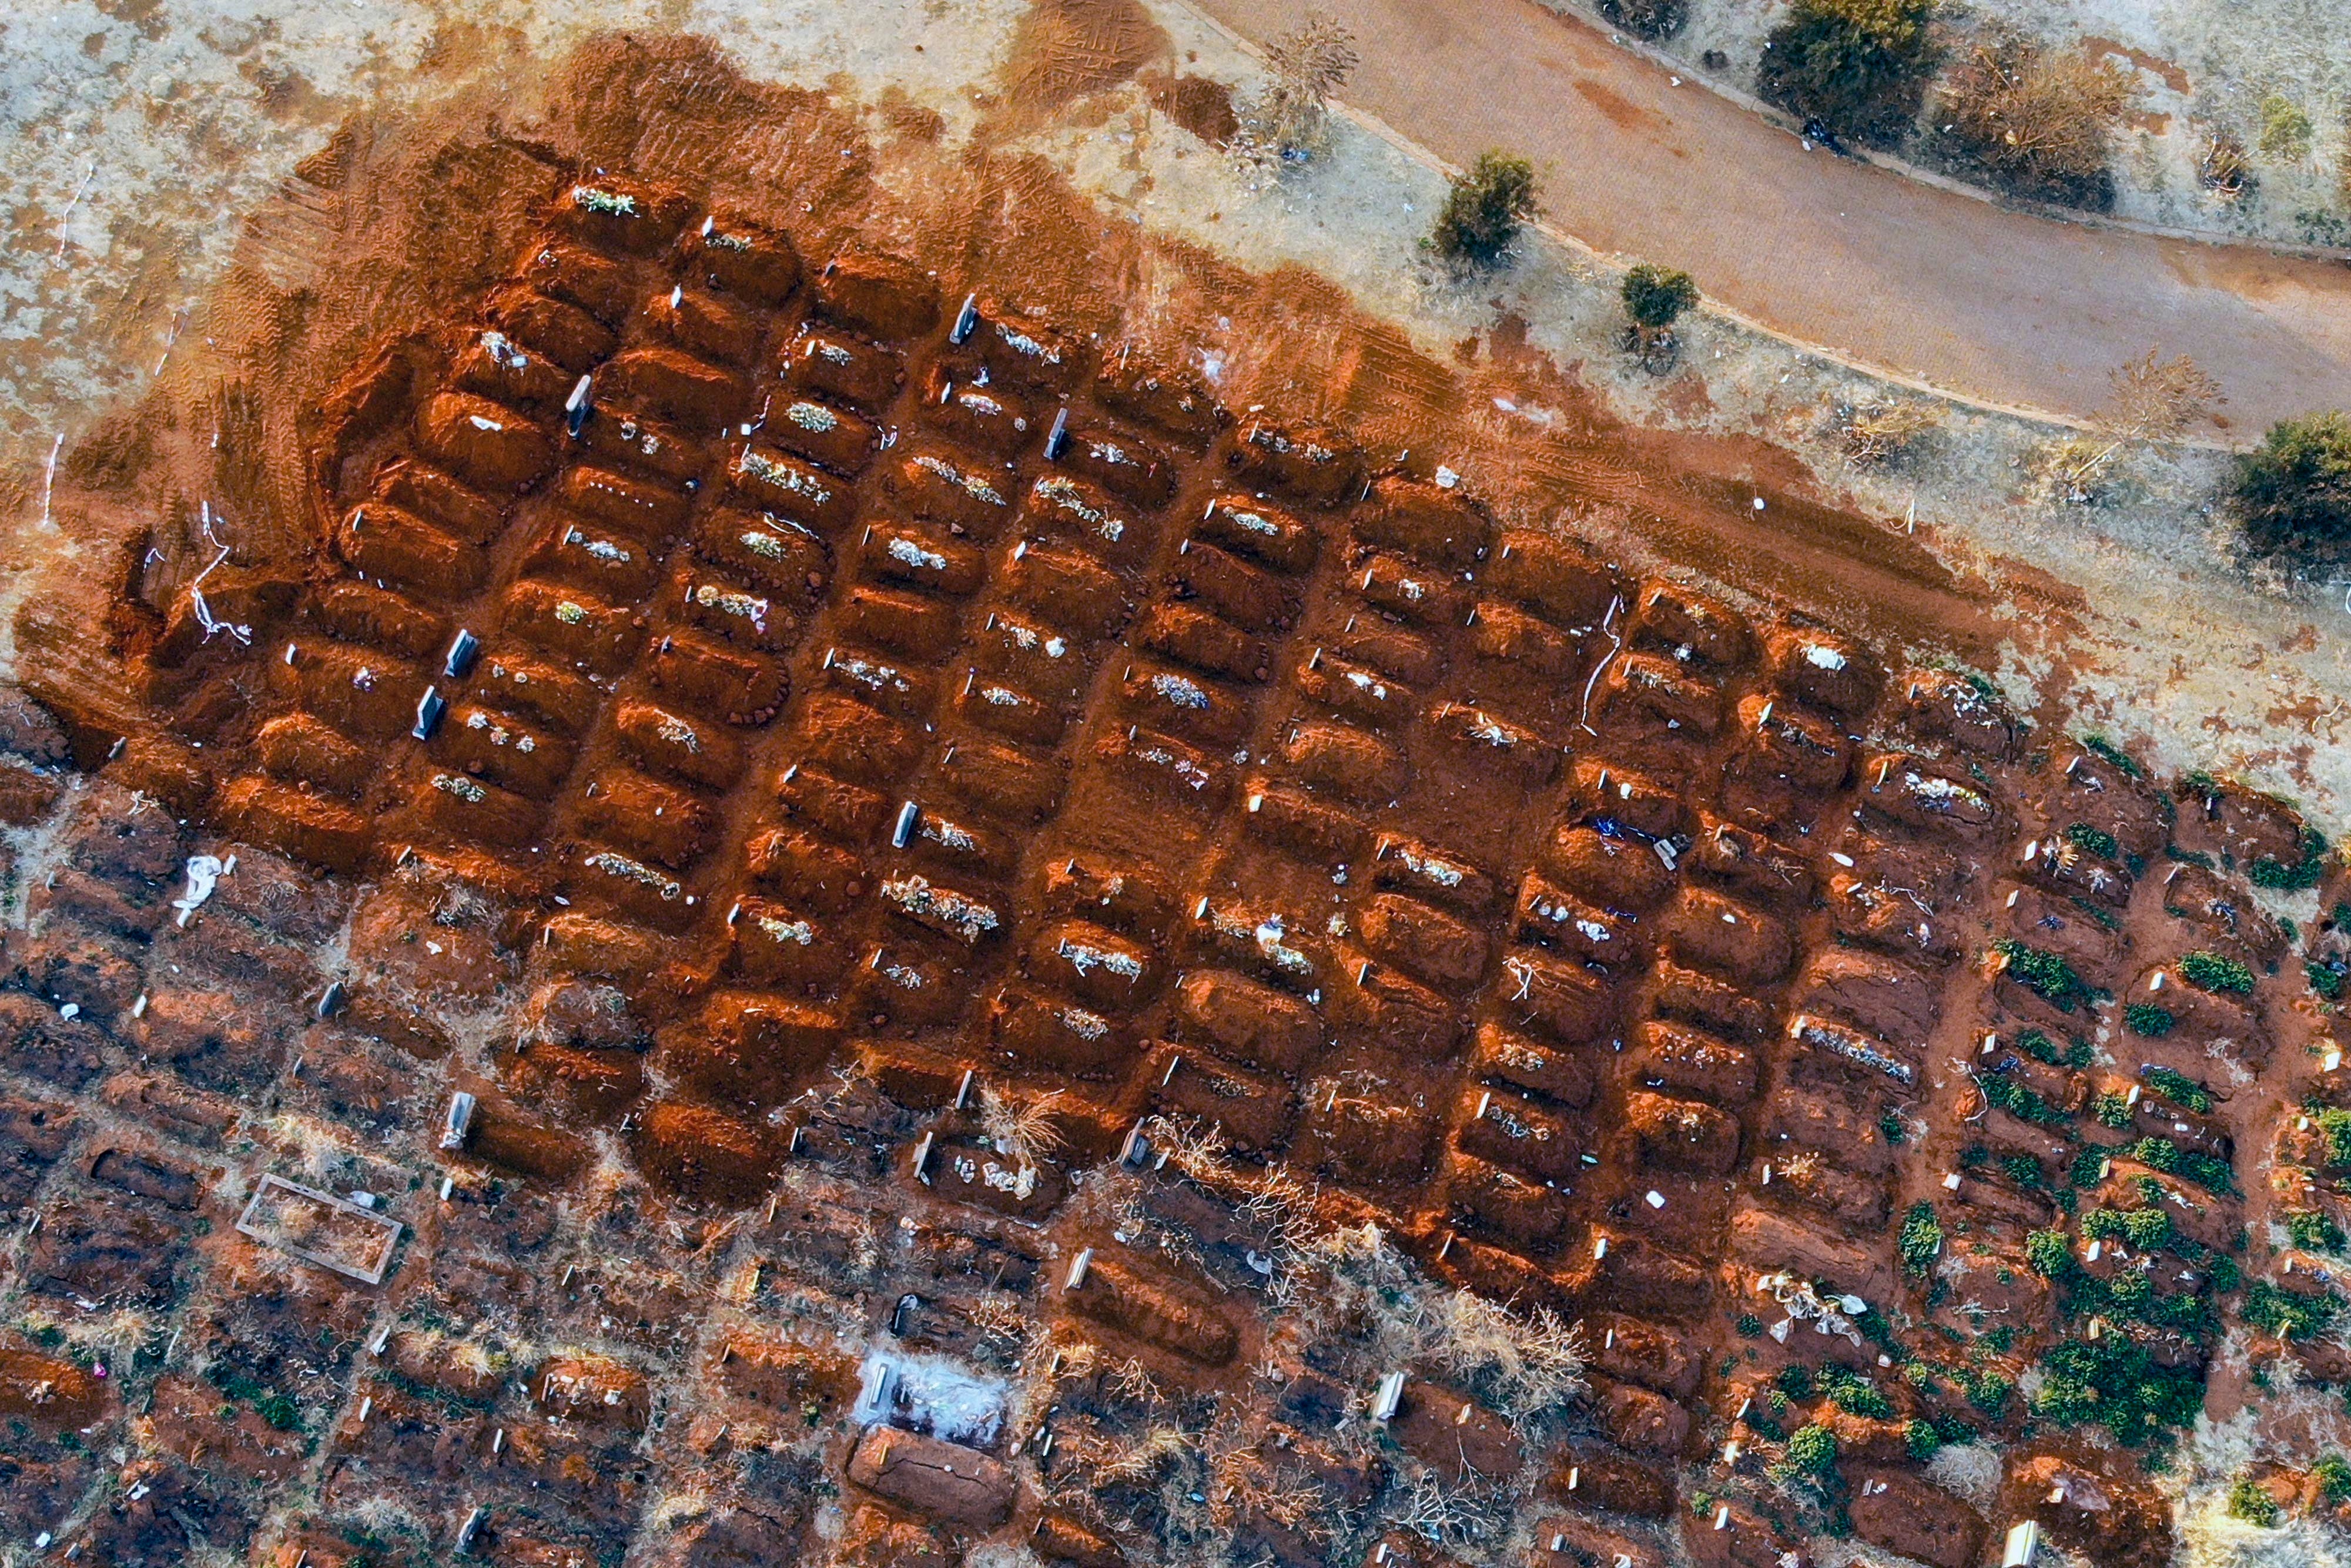
Nine months later, the pandemic took its millionth life. And while the vagaries of record-keeping mean we may never know who that victim was, the fact remains: COVID has killed a million people.
Tens of millions of things undone. Daughters and sons unborn, works of genius uncreated. Pieces of communities — excised. Entire residential complexes filled with older people — ravaged. Human contribution melted away, with no way of ever knowing or chronicling what was lost. Accounting for what’s missing when people die is never an easy task; now it is one multiplied by an entire million.
A new Associated Press interactive map of the coronavirus’ spread — represented by the lives it has claimed — blends data and geography in a way that forces us to see what has happened to the world. And what is still happening to it.
Like so many things in the world, it started small. At first, the map shows only one splash of color: China, the place where the coronavirus silently began its march
As it began to move around, the map evolved. Month by month, week by week, day by day, the coronavirus spread. Pandemic was declared. Hospitals girded. Cities and countries, shut down. The world changed so fast that its people could barely keep up.
How did something so contained at first, so localized, upend the routines and activities of huge chunks of human civilization?
We all have watched it, lived through it, but the visual is striking. From a world largely unsullied by the virus to one merely touched by it to an entire planet feeling its effects. Choose a place to pause. Each juncture offers a window into that moment.
— March 18, 2020. China still leads the world in deaths. In the United States President Donald Trump has just declared a state of emergency. The United States has lost 191 people. The wide belief among Americans: This can still be contained.
— April 6, 2020. Italy is being ravaged; 16,523 have been lost. China has dropped out of the top five when it comes to deaths. The United States is second by now at 14,199 dead.
— May 22, 2020. The United States has shot ahead of the rest of the world and sits on the cusp of 100,000 dead — 99,166. It, like the United Kingdom (35,440), Italy (32,616), Spain (28626) and France (28,292), is rendered in a darker forest green, along with Brazil The march is accelerating.
— July 26, 2020. In the heart of the summer, the United States remains the country with the most dead: 147,656. Brazil, whose president has just tested positive for coronavirus, is second at 87,004. Darker greens are starting to fill the map, including in India. In China, blamed by Trump for the virus in terms some deem racist, the hue is light after strict and protracted containment measures.
— Sept. 27, 2020. This past Sunday. India is third in the world with 95,542 deaths. The United States, still No. 1 and criticized for its haphazard efforts at containment, has just passed the 200,000 mark. Brazil sits at 141,741, with no apparent detrimental political effect on its leader. Russia is now darker green. Africa, Australia and much of Asia are lighter, though swaths of Southeast Asia are showing higher death rates.
This map tells the story of an invisible virus that upended the world. It tells of first responses and fear and decisions good and bad. Stories of valiant women and men who tried to stop it, and were sometimes claimed by their efforts. It tells stories of leaders who measured up and leaders who didn’t. And how simple human touch ended up killing.
Most of all, it tells of the 1 million dead and gone. These are the stories of the human beings who, had they been able to stick around, might have done things we’d all remember — or might have done things just as important that only a few people they loved would remember. The map contains their stories, too, and even amid the elegant lines of the map and the illuminating contours of the data they should not be forgotten.
___
Ted Anthony, director of digital innovation for The Associated Press, oversees the news organization’s coverage of the pandemic’s ripple effect on society. Follow him on Twitter at http://www.twitter.com/anthonyted
Bookmark popover
Removed from bookmarks