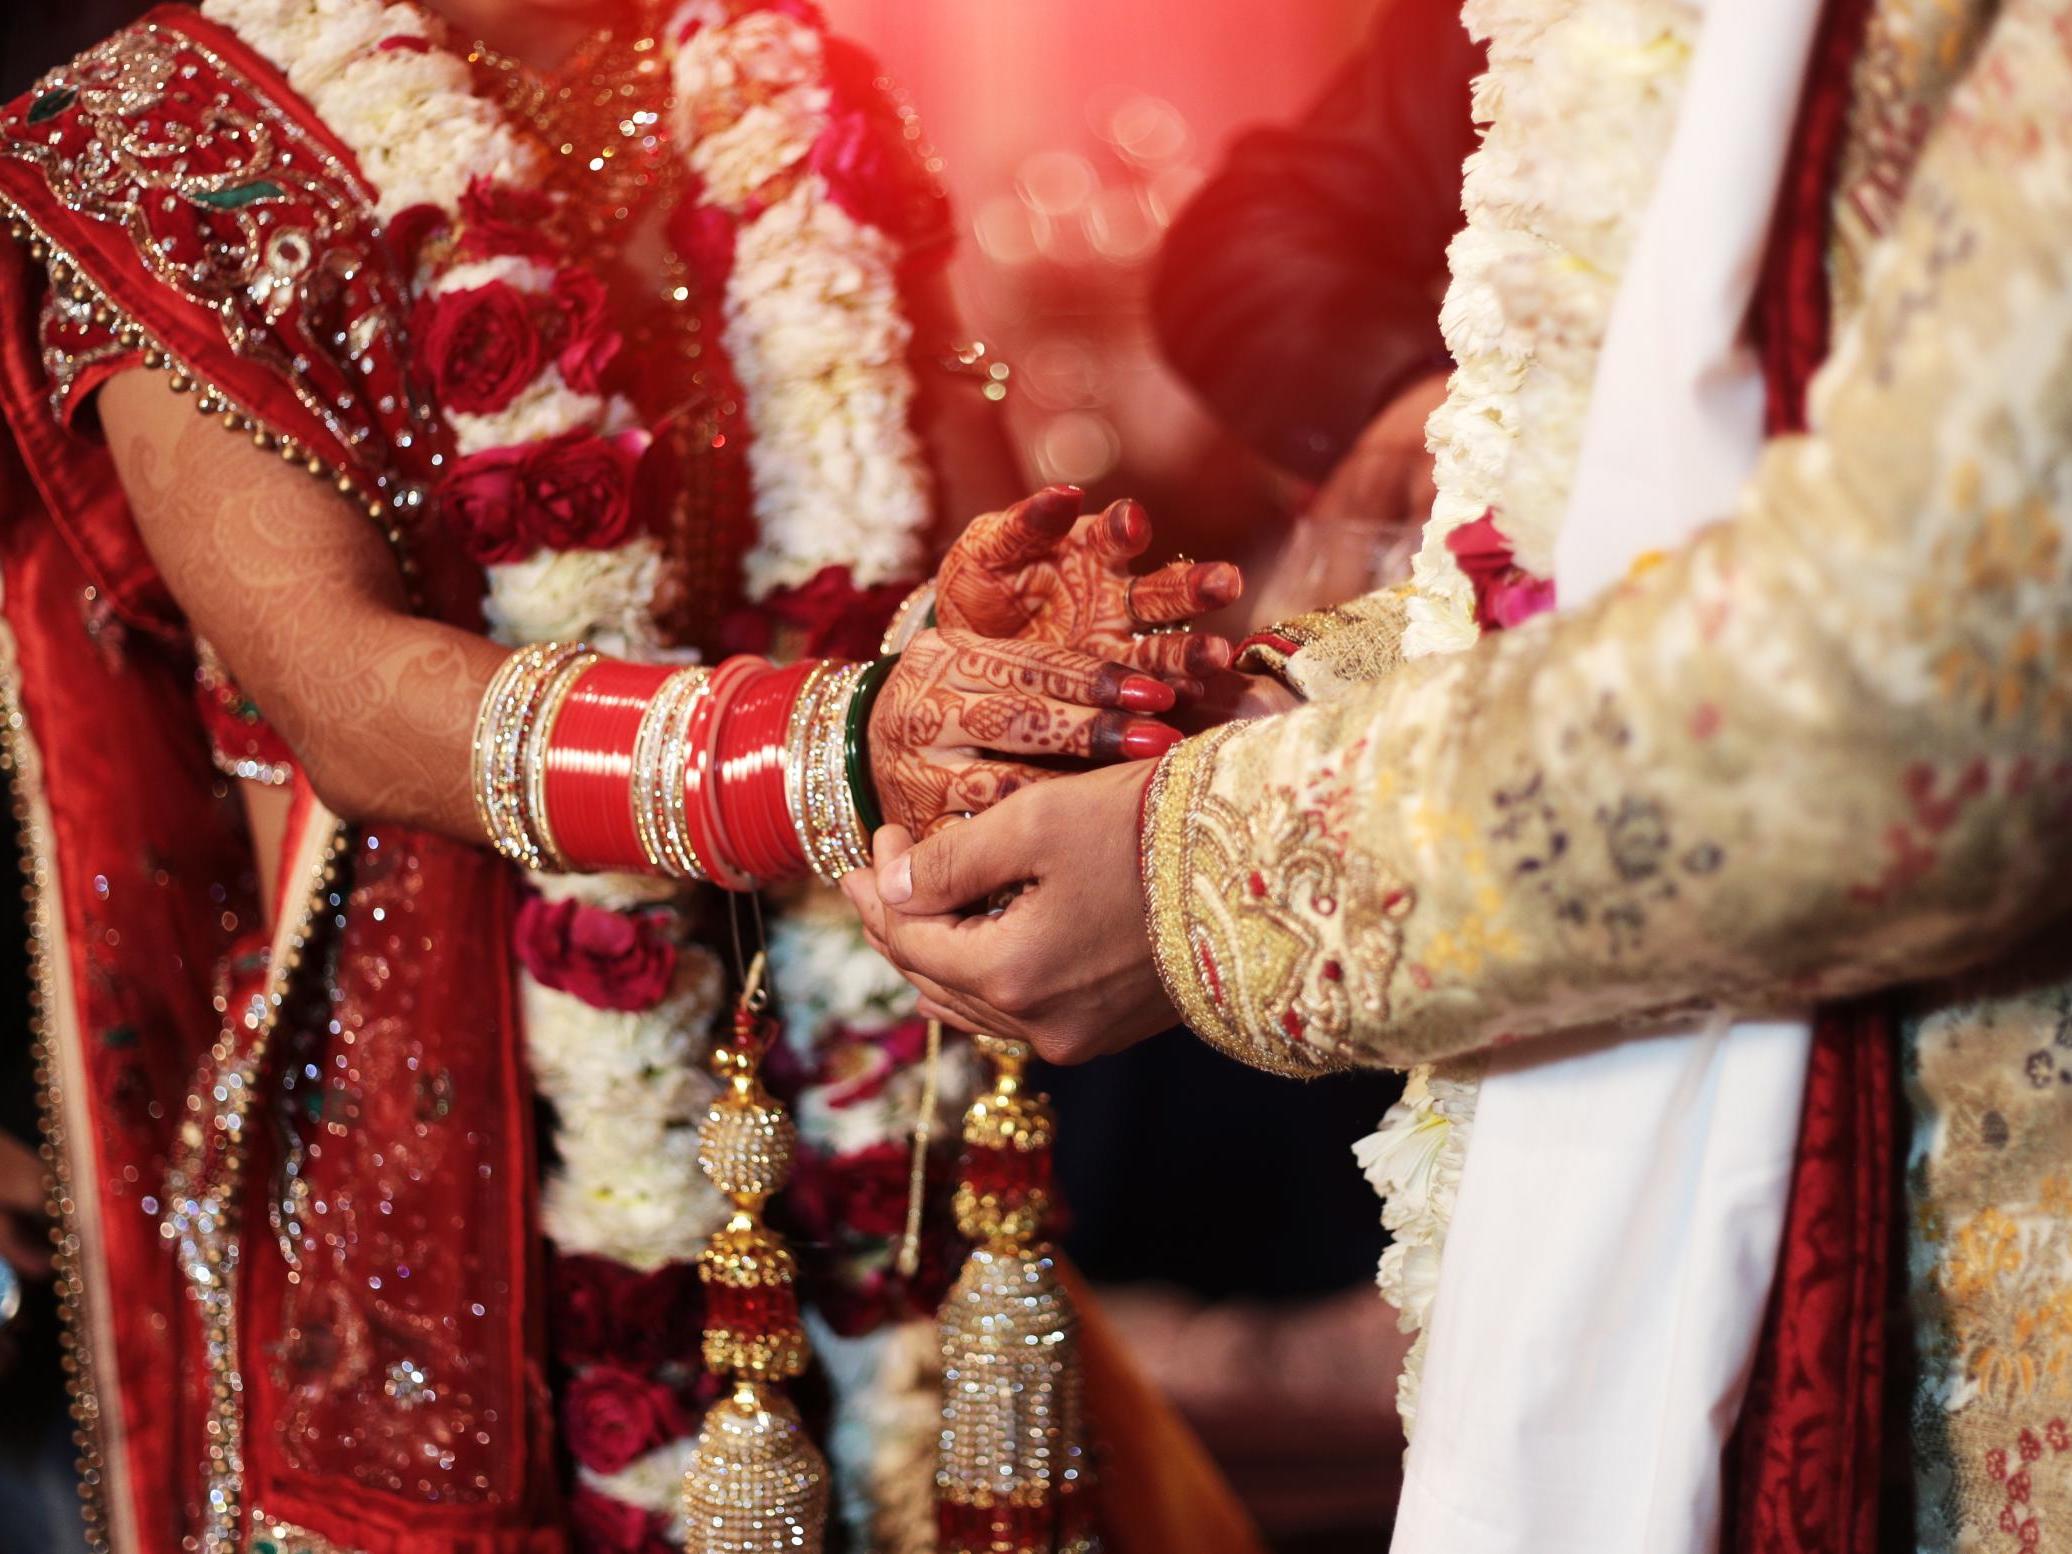
Most popular day of the year to get married in England and Wales revealed to be 2nd September
The number of marriages is declining year on year

Your support helps us to tell the story
From reproductive rights to climate change to Big Tech, The Independent is on the ground when the story is developing. Whether it's investigating the financials of Elon Musk's pro-Trump PAC or producing our latest documentary, 'The A Word', which shines a light on the American women fighting for reproductive rights, we know how important it is to parse out the facts from the messaging.
At such a critical moment in US history, we need reporters on the ground. Your donation allows us to keep sending journalists to speak to both sides of the story.
The Independent is trusted by Americans across the entire political spectrum. And unlike many other quality news outlets, we choose not to lock Americans out of our reporting and analysis with paywalls. We believe quality journalism should be available to everyone, paid for by those who can afford it.
Your support makes all the difference.The Office for National Statistics has revealed the most popular date for couples to get married in England and Wales.
In 2017, the latest data available, the most popular day of the year to tie the knot was 2 September (a Saturday) when 4,370 weddings took place on a single day.
The least popular day to get married in 2017 was Christmas Day (25 December) when only three marriages took place.
The same data for 2020 is likely to be skewed given the impact of the coronavirus outbreak and couples having to postpone or cancel planned nuptials.
There has been an overall decline in the number of marriages between opposite-sex couples, with 242,842 marriages registered in 2017 – a fall of 2.8 per cent from 2016.
This marks a 45 per cent decrease since 1972 – a pattern of long and steady decline.
Some 6,932 were between same-sex couples – 44 per cent male couples and 56 per cent female couples – a similar figure to 2016.
The average age at which heterosexual couples now marry has reached 35.7 years for women and 38 years for men.
By comparison, the average age for same-sex couples was 40.1 years for men and 36.6 years for women.
Marriage rates for the over 65s have increased, climbing 31 per cent for men and 89 per cent for women, this is compared to a steep drop in opposite-sex marriages under the age of 20.
Reasons given for the drop in marriage and increasing age at which they happen have been attributed to everything from student debt to trying to get on to the property ladder leaving less money for a wedding.
Another reason is the decreasing taboo around continued cohabitation before marriage.
Religious wedding ceremonies now make up less than one in four (23 per cent) of marriages between opposite-sex couples and only 0.6 per cent of same-sex marriages.
Join our commenting forum
Join thought-provoking conversations, follow other Independent readers and see their replies
Comments