Census 2021: Top 10 areas with largest population growth in last 10 years – see how yours has changed
Southern England leads the rise but population was up all over

The first results from the 2021 census have been released, showing population estimates for England and Wales.
More people were living in both countries than ever before, with 59,597,300 recorded residents last spring (56,489,800 in England and 3,107,500 in Wales).
The population was up 3.5 million (6.3 per cent) from the last census in 2011, when it was 56,075,912 – though it rose at a slower rate than between 2001 and 2011 when it went up by 7.8 per cent (4 million).
Since Britain first took a census in 1801, the rate of population growth in England and Wales was highest between then and 1911, when the population grew 13.6 per cent on average each decade.
The only decade in which the total population declined was 1971-81, when it went down 0.5 per cent. But there are usually several local areas which see a decline. This time there were 25.
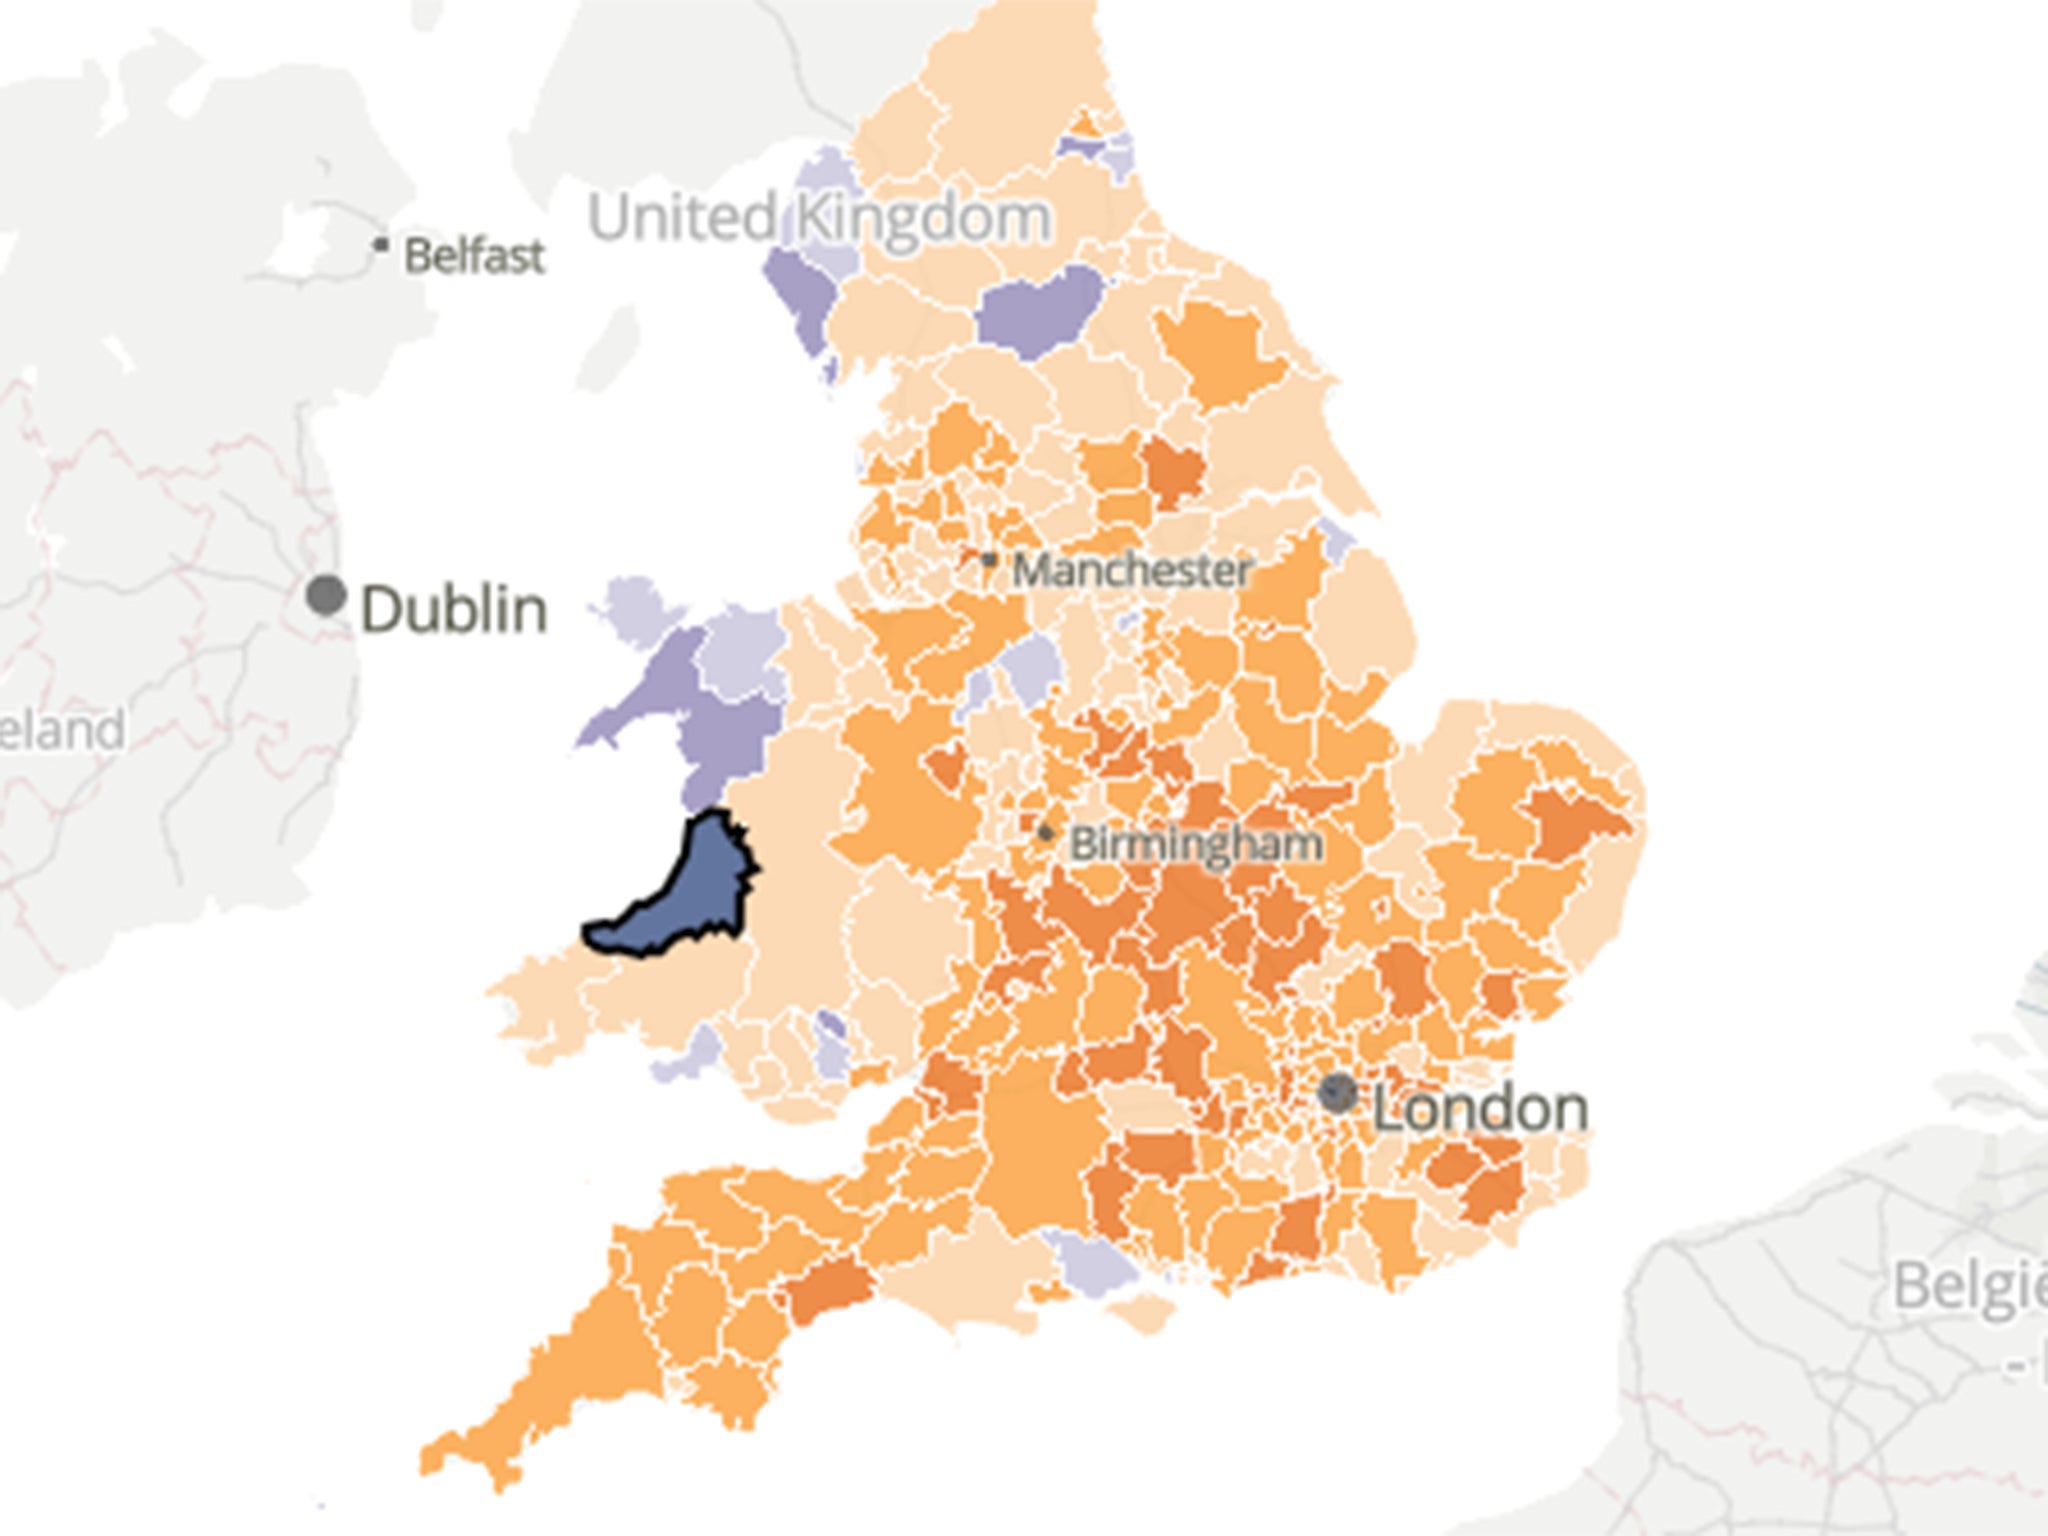
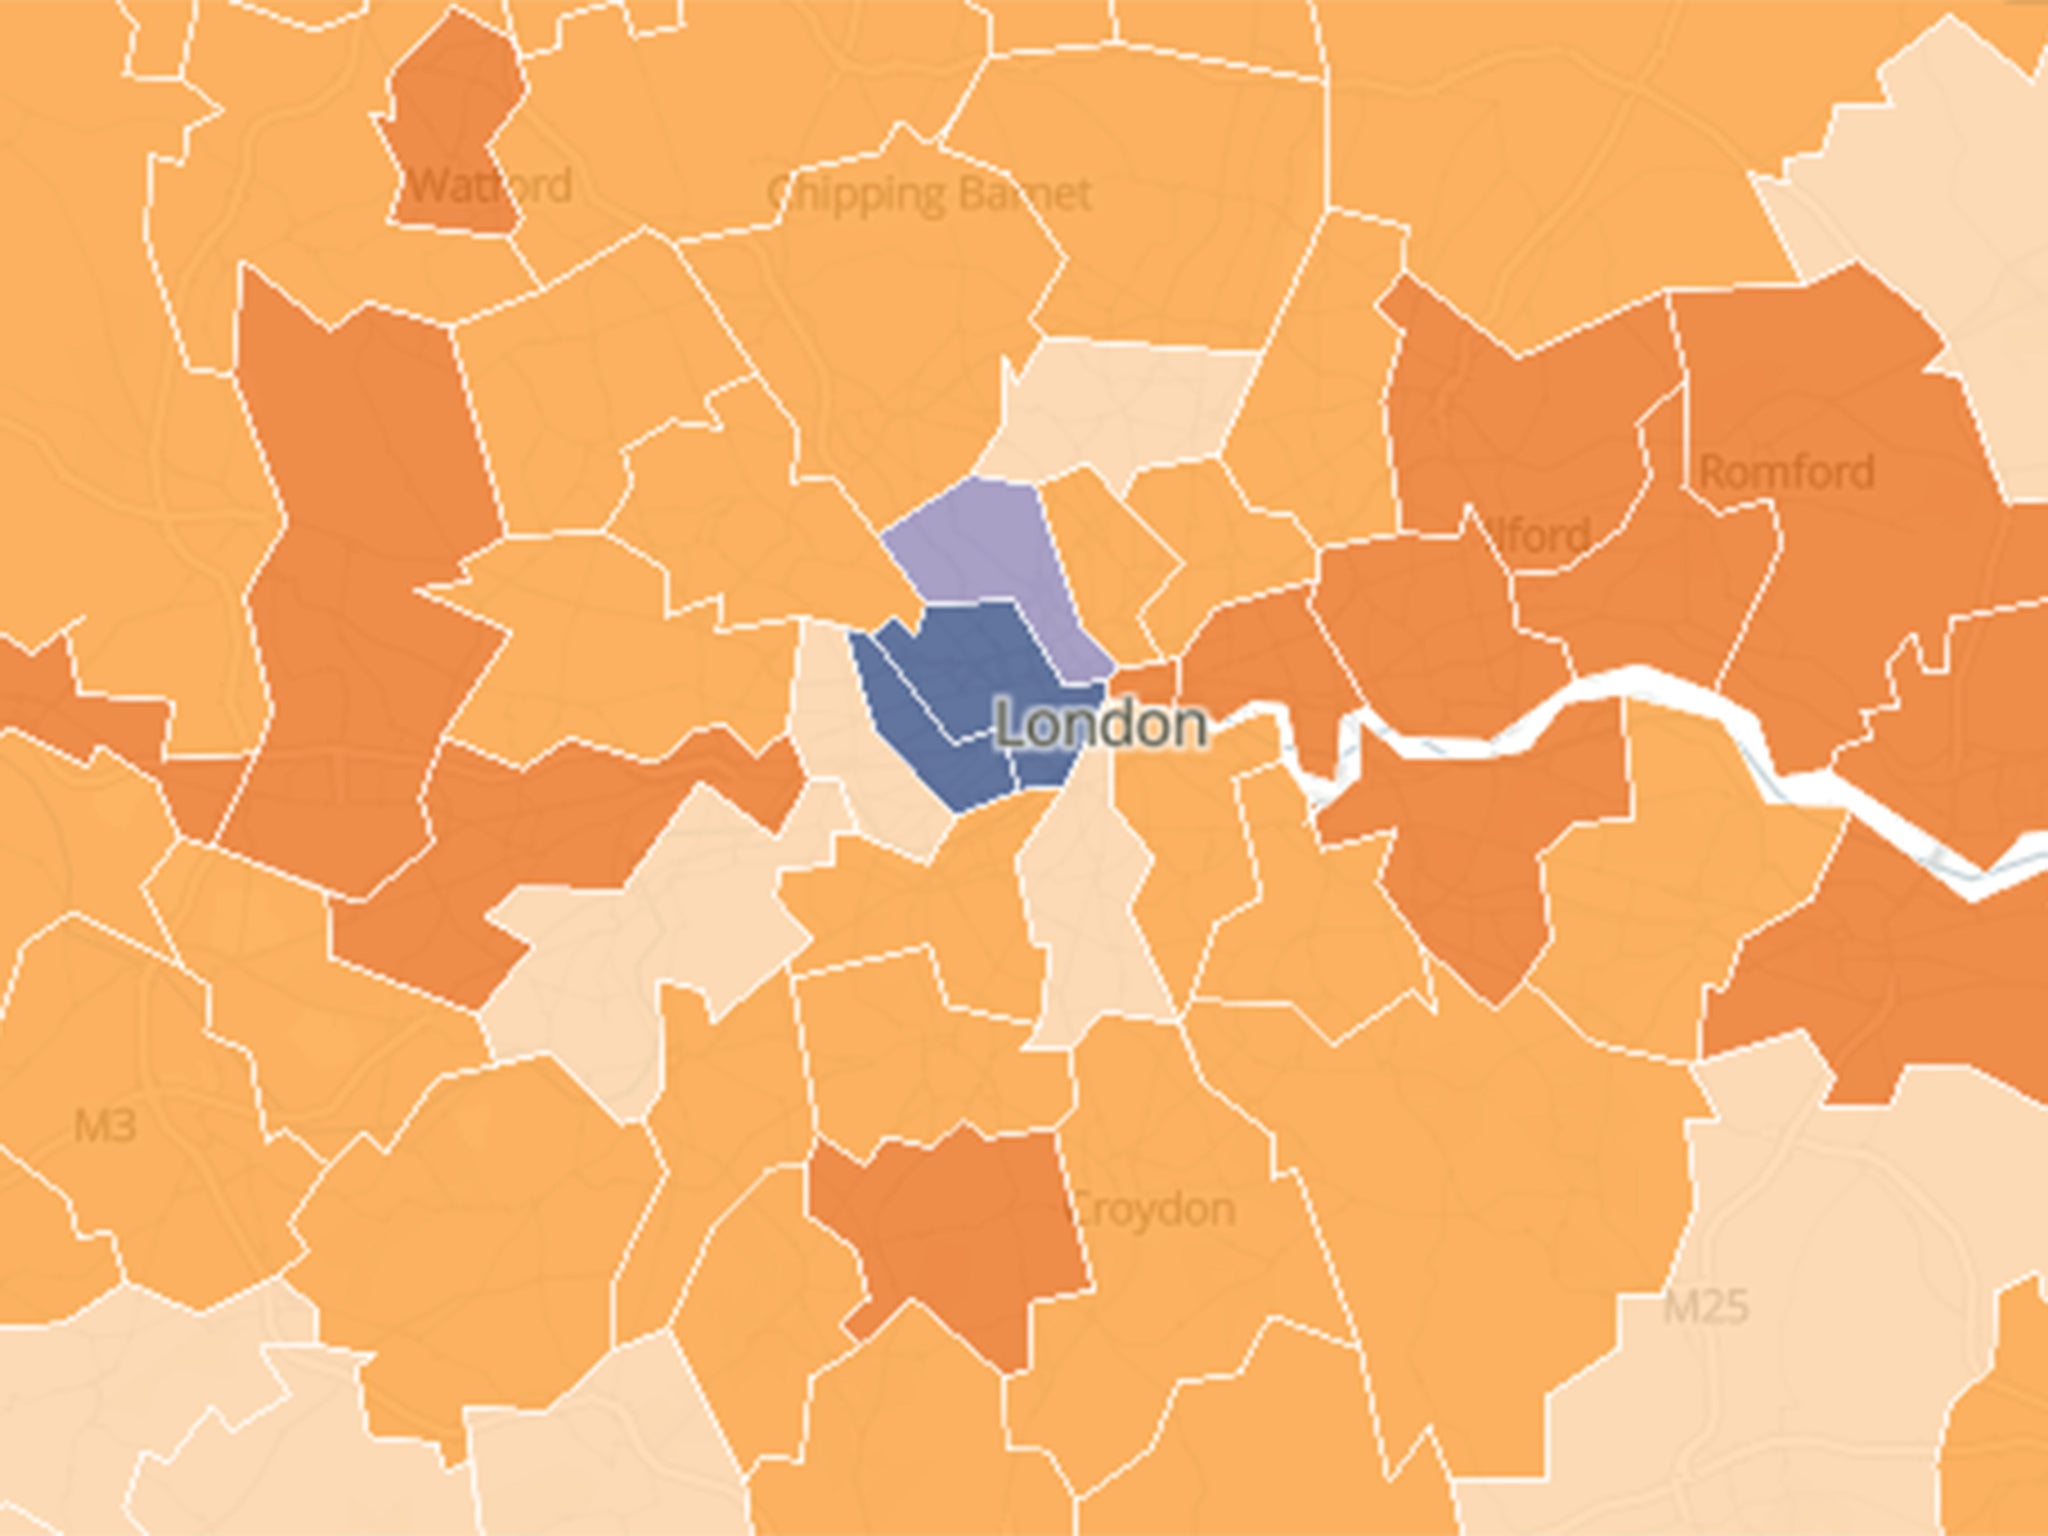
The biggest drop was in the London Borough of Kensington and Chelsea, which lost 9.6 per cent of its population in the 10 years to last March.

The neighbouring City of Westminster saw the second-biggest drop at 6.9 per cent. The biggest drop in Wales was in Ceredigion, at 5.8 per cent.
Despite local dips, the population rose in every region in England and the whole of Wales.
Figures showed the southeast remained the most populous region in England with 9.3 million people, followed by London, 8.8 million, while the northeast was the least populous, 2.6 million.

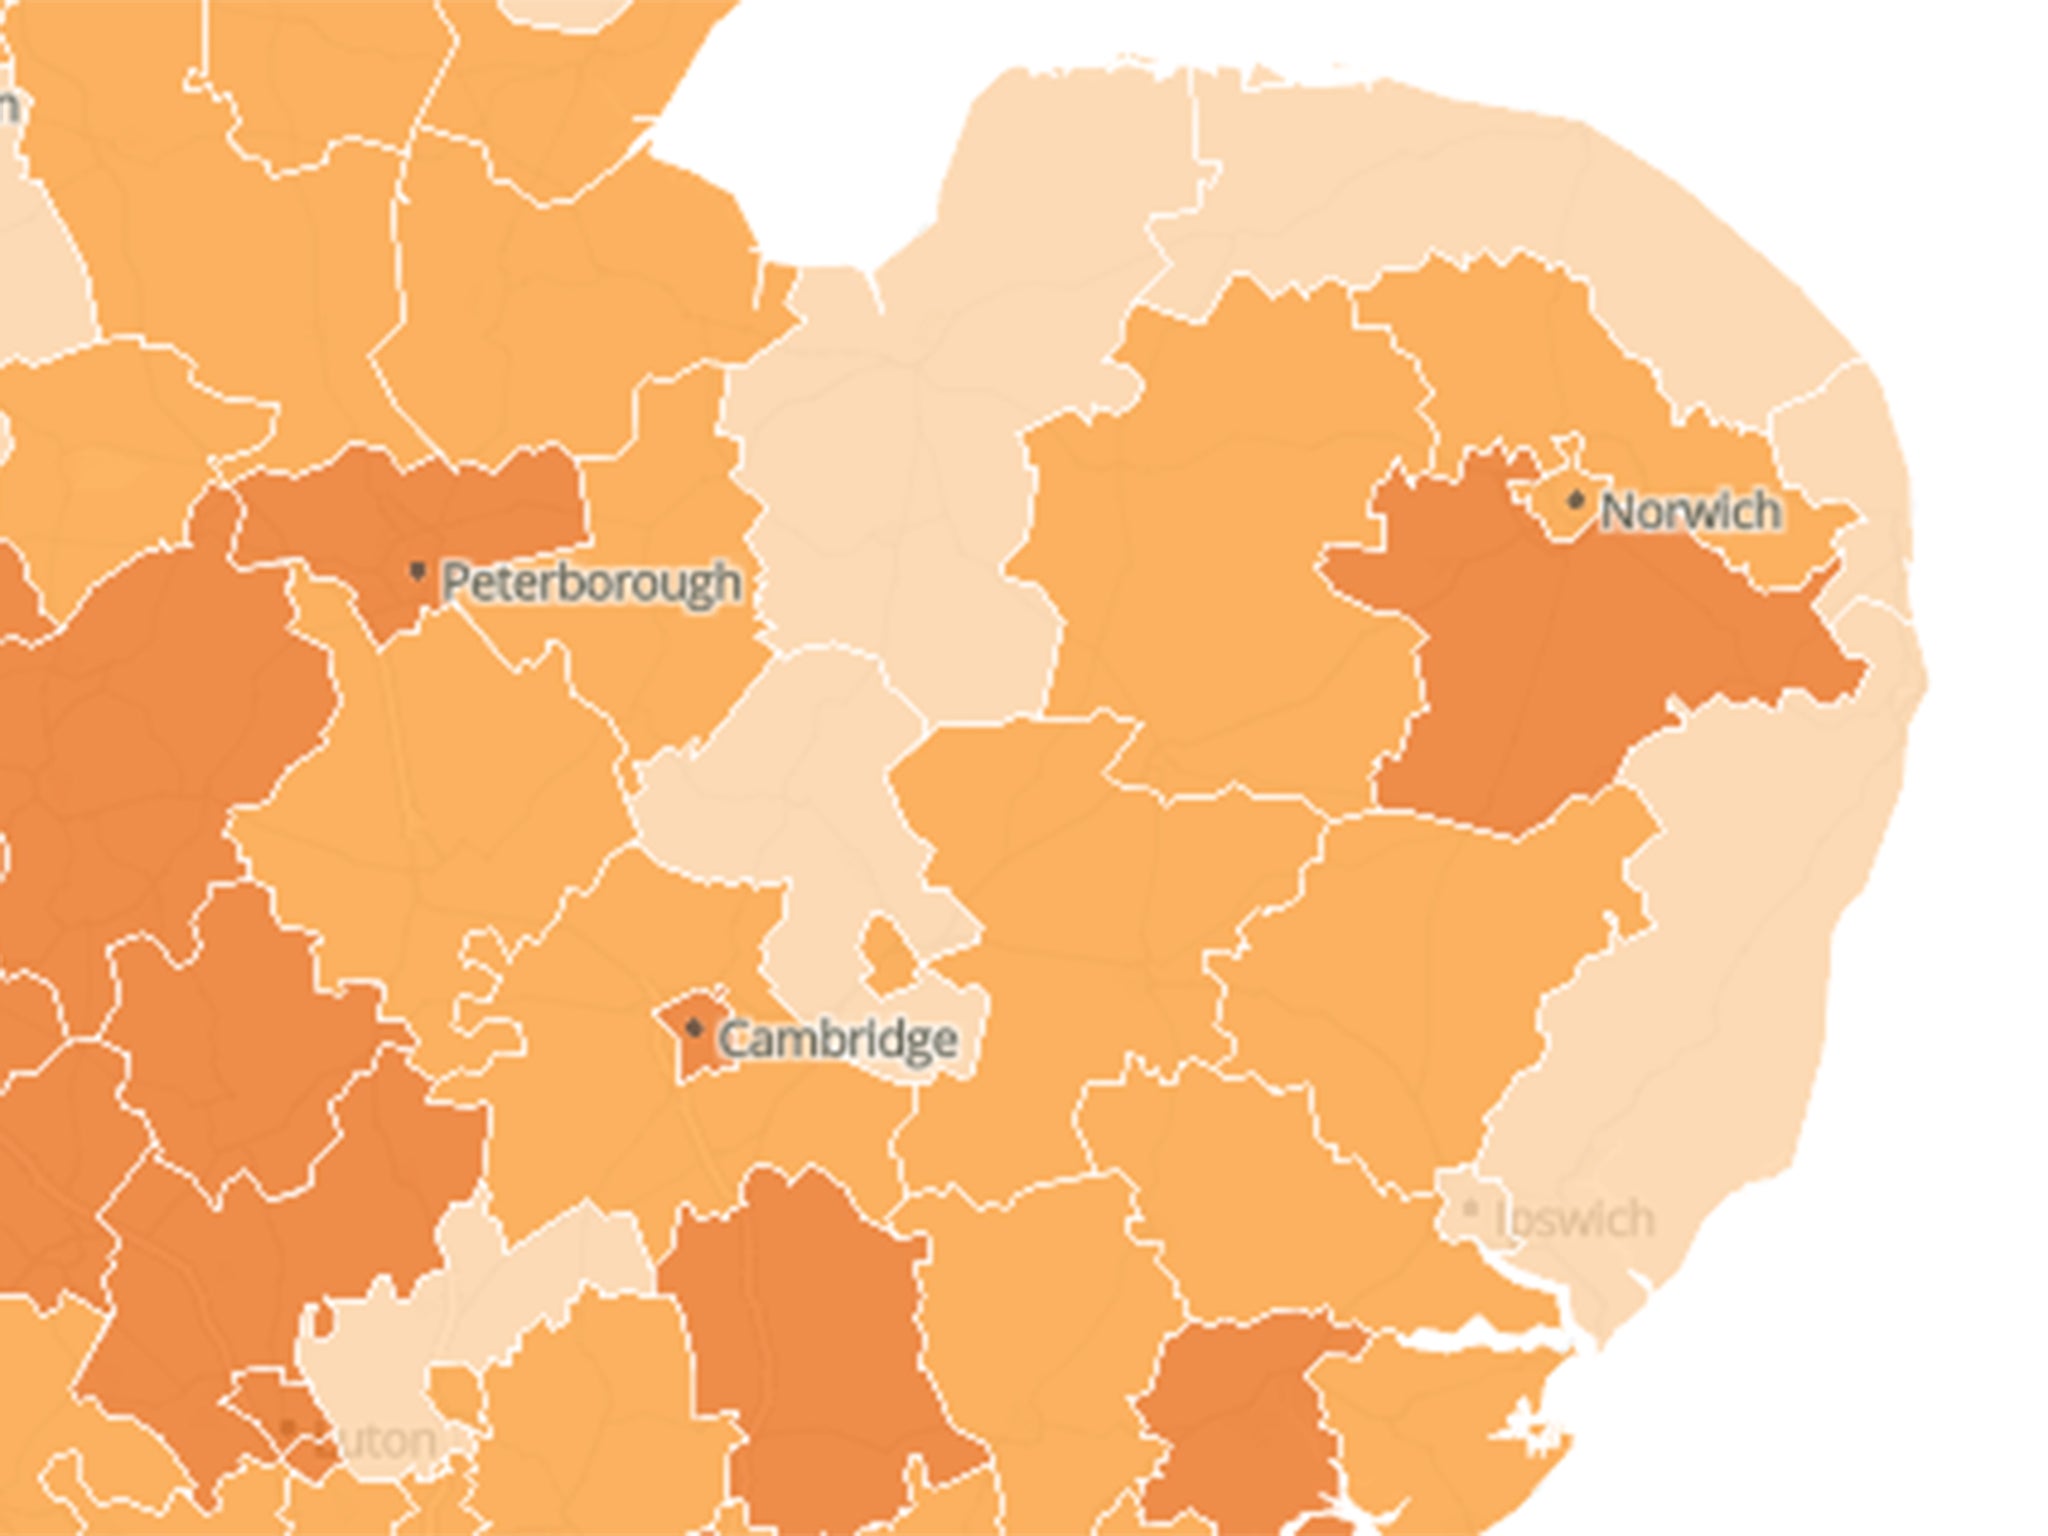
The East of England saw the biggest percentage rise in population, up 8.3 per cent from 5.8 million to 6.3 million.
The population of London grew by 7.7 per cent, up from 8.2 million to 8.8 million.
The Office for National Statistics, which collects census data, has sorted the data by every local authority from Cornwall up to Northumberland. The data can be viewed in full here.
Scotland delayed its census until March 2022 and Northern Ireland has yet to publish its 2021 result.
Below The Independent has compiled a list of the 10 local authorities with the highest percentage rise in population.
Top 10 areas with largest population growth
- Tower Hamlets (London borough). Up 22.1 per cent from 254,096 to 310,300
- Dartford, Kent. Up 20 per cent from 97,365 to 116,800
- Barking and Dagenham (London borough). Up 17.7 per cent from 185,911 to 218,900
- Bedford, Bedfordshire. Up 17.7 per cent from 157,479 to 185,300
- Cambridge, Cambridgeshire. Up 17.6 per cent from 123,867 to 145,700
- Peterborough, Cambridgeshire. Up 17.5 per cent from 183,631 to 215,700
- City of London. Up 16.6 per cent from 7,375 to 8,600
- Tewkesbury, Gloucestershire. Up 15.8 per cent from 81,943 to 94,900
- Central Bedfordshire. Up 15.7 per cent from 254,381 to 294,200
- Salford, Greater Manchester. Up 15.4 per cent from 233,933 to 269,90


Join our commenting forum
Join thought-provoking conversations, follow other Independent readers and see their replies
Comments