Hot today? This map can tell you how much the climate crisis is to blame
New tool shows how much more likely today’s weather has become due to the climate crisis
Your support helps us to tell the story
From reproductive rights to climate change to Big Tech, The Independent is on the ground when the story is developing. Whether it's investigating the financials of Elon Musk's pro-Trump PAC or producing our latest documentary, 'The A Word', which shines a light on the American women fighting for reproductive rights, we know how important it is to parse out the facts from the messaging.
At such a critical moment in US history, we need reporters on the ground. Your donation allows us to keep sending journalists to speak to both sides of the story.
The Independent is trusted by Americans across the entire political spectrum. And unlike many other quality news outlets, we choose not to lock Americans out of our reporting and analysis with paywalls. We believe quality journalism should be available to everyone, paid for by those who can afford it.
Your support makes all the difference.As many parts of the US face down the second straight week of temperatures over 100F (38C), people may be tempted to blame the sweaty weather on the climate crisis.
Overall, that may be a good instinct – as greenhouse gases like carbon dioxide have warmed the atmosphere, heatwaves have gotten both more frequent and more intense.
But just because the planet is generally getting hotter, doesn’t mean the climate crisis is to blame for every hot day – some days are just hot.
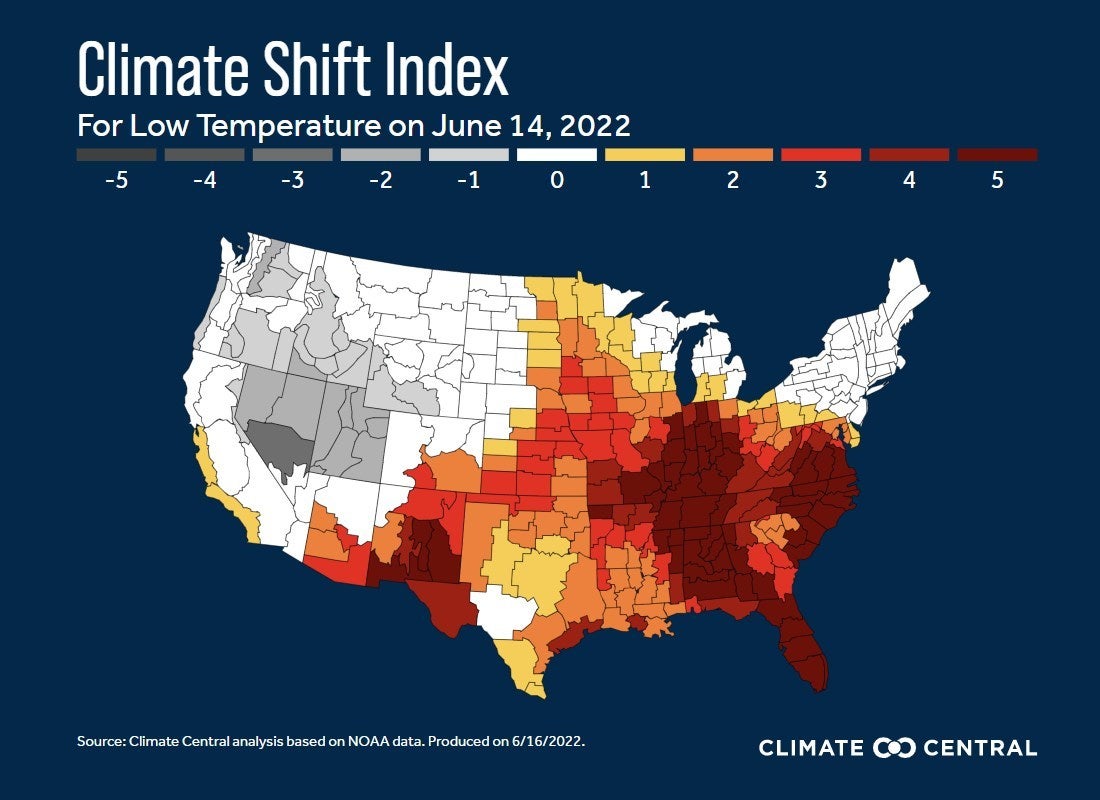
Now, a new tool called the Climate Shift Index, developed by nonprofit Climate Central, offers some clarity on just how much the climate crisis may be responsible for the weather today.
“Climate change is invisible to most people, but it already affects our daily lives,” Climate Central chief executive Benjamin Strauss said via a press release.
“When it’s too hot to safely work outside, play sports, or walk down a city street, the Climate Shift Index will reveal its fingerprint. When crops wilt, when tornadoes or fires erupt in unseasonal heat, the Climate Shift Index can put those events in context.”
The index, which covers the Lower 48 United States, measures how much the climate crisis has changed the likelihood that any individual day’s high and low temperature would have occurred.
For example, Wednesday’s forecast high for the Florida Panhandle is around 100.4F (38C) – which the map says is 8.7F above normal.
According to their analysis, that equals a Climate Shift Index of 2, meaning tomorrow’s high temperature has become twice as likely to occur because of the human-driven climate crisis.
To put it another way, their website notes that if a 90F day used to occur about once every June, but now occurs around three times every June, the 90F day would get a score of 3 – meaning it has become three times as likely.
In addition to the day’s high temperature, the index assigns a score to the day’s low temperature – indicating how much more likely that nighttime temperature has become.
Climate Central notes that changes to low temperatures can be important too, as people and places may not get as much of a chance to cool down overnight, leading to a higher risk of health issues from the heat.

And on some days, the temperature is lower than expected – which the index measures with a negative score. While this temperature has become less likely due to the climate crisis, their website notes that “cold days still occur”.
They also point out that this map doesn’t necessarily show that the climate crisis is to blame for the day’s weather, just that it made the temperature more or less likely to occur.
In the past couple of decades, scientists have gotten very good at determining just how much the climate crisis has contributed to individual extreme weather events like heatwaves.
A group called World Weather Attribution, for example, found that human-driven warming made last year’s heatwave in the Pacific Northwest both more likely to happen and about 2C hotter.
But this new tool offers an immediate look at how the climate crisis may be altering more mundane weather.
“When extreme weather occurs, we talk about climate change – when it hits us in the face,” Friederike Otto, a climate scientist at Imperial College London who worked on the research behind this new tool and helps lead the World Weather Attribution group, said via the press release.
“But climate change is affecting weather every day, temperatures most strongly, with consequences we haven’t even started to think about, let alone calculate and prevent.”


Join our commenting forum
Join thought-provoking conversations, follow other Independent readers and see their replies
Comments