Show your Stripes Day meaning: Why are people sharing climate crisis graphic today
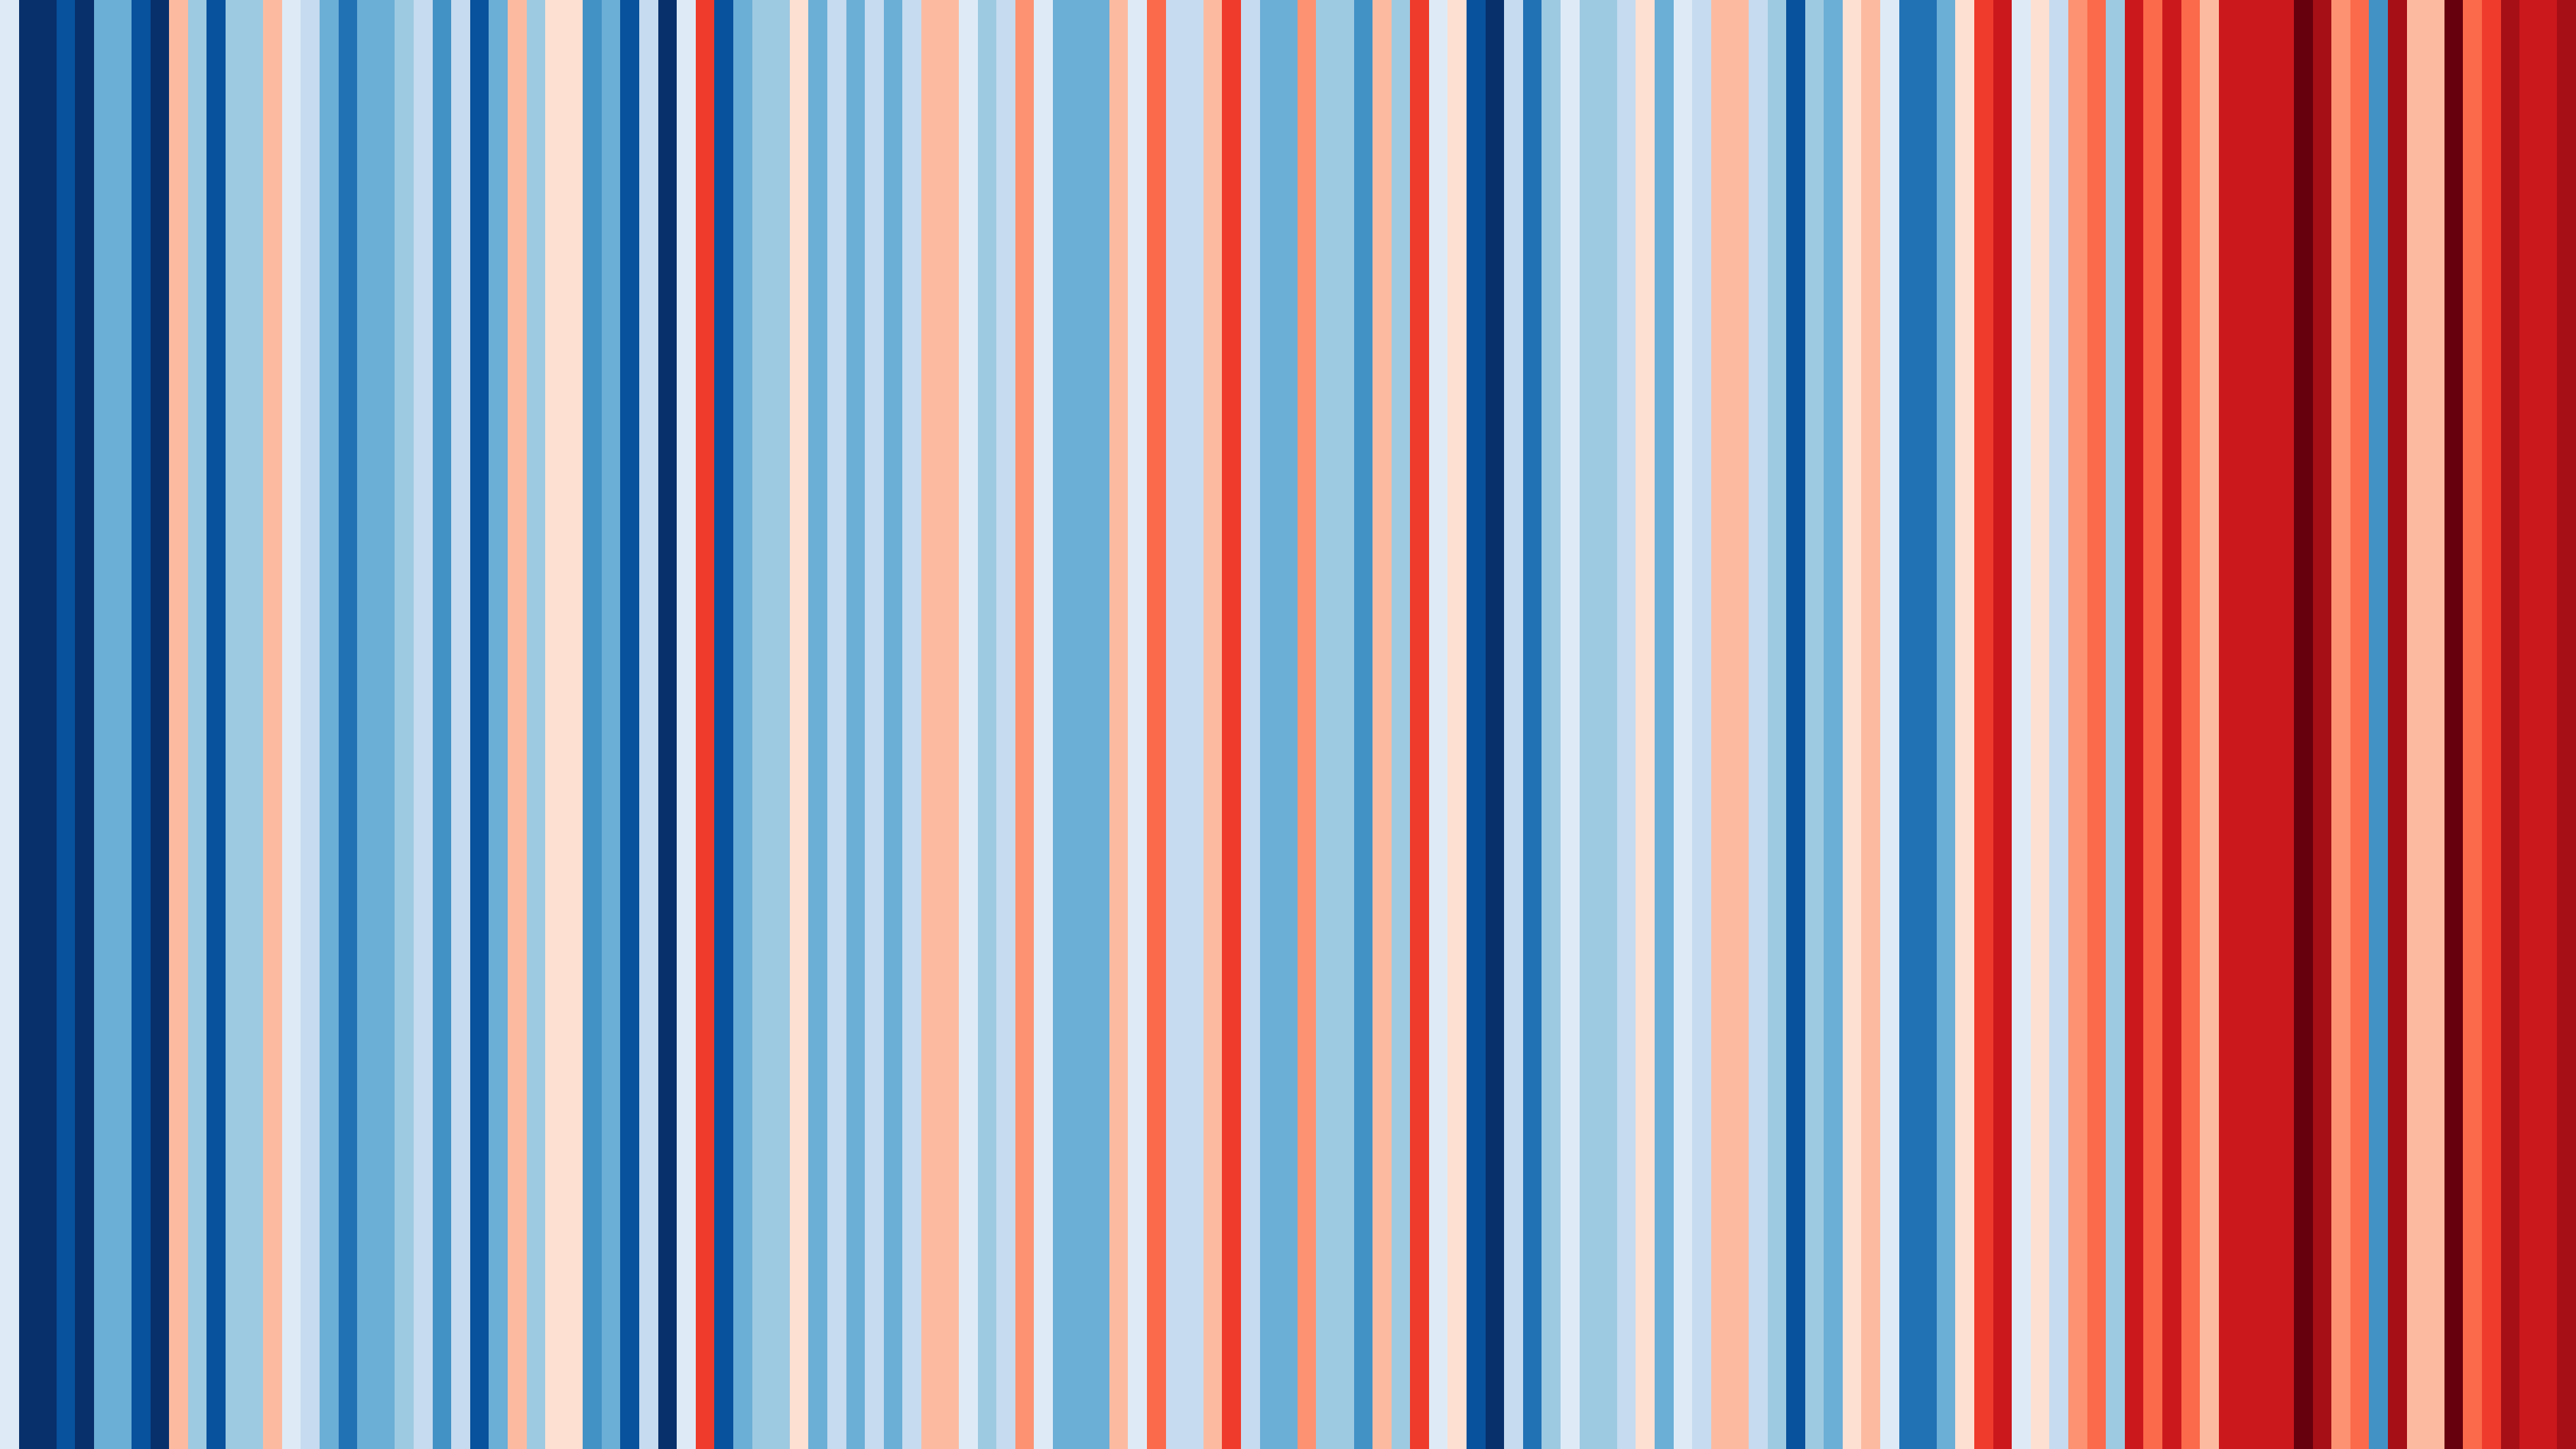
The stripes, which show average annual temperatures based on colour, are designed to illustrate rising global temperatures and spark conversations and action around the climate crisis

Your support helps us to tell the story
From reproductive rights to climate change to Big Tech, The Independent is on the ground when the story is developing. Whether it's investigating the financials of Elon Musk's pro-Trump PAC or producing our latest documentary, 'The A Word', which shines a light on the American women fighting for reproductive rights, we know how important it is to parse out the facts from the messaging.
At such a critical moment in US history, we need reporters on the ground. Your donation allows us to keep sending journalists to speak to both sides of the story.
The Independent is trusted by Americans across the entire political spectrum. And unlike many other quality news outlets, we choose not to lock Americans out of our reporting and analysis with paywalls. We believe quality journalism should be available to everyone, paid for by those who can afford it.
Your support makes all the difference.Climate scientists, broadcast meteorologists, and citizens are uniting on 21 June — the summer solstice or Show Your Stripes Day — to raise awareness around the climate crisis.
The Show Your Stripes campaign is centred around data visualisations developed by Professor Ed Hawkins, a climate scientist at the University of Reading and lead author of the Intergovernmental Panel on Climate Change’s Sixth Assessment Report.
The “Warming Stripes” graphics are visual representations of changes in temperature since the early 20th century. Each stripe represents the average annual temperature in a given country, region or body of water.
For essentially every region or country, the stripes change from mainly blue to mainly red in recent years, illustrating the average annual rise in temperature.
Professor Hawkins said: “The Warming Stripes are a simple and compelling way to visualise that the world is warming and that every country is warming.
“The graphics can help start local conversations about the increasing risks from climate change wherever you live, and the necessary actions to avoid the worst consequences.”
Data are available for most countries dating back to 1901, and even earlier for oceans, the UK the US, Switzerland, Germany, and the cities of Stockholm and Vienna. The data comes from the Berkeley Earth temperature data set, the UK Met Office’s HadCRUT5.0 data set, and some countries’ national meteorological agencies.
The graphics have been designed to be as simple as possible, in order to spark conversations around the climate crisis, rather than overload viewers with complex data and jargon.
The Show Your Stripes campaign is a collaborative effort with Climate Central, an independent organisation of climate scientists and journalists researching and reporting on how the climate is changing and the impact these changes have on the public.
Weather presenters and the general public are invited to take part in the campaign by downloading the “Warming Stripes” for their country or region and posting it to social media using the #ShowYourStripes and #COP26 hashtags. Ready-to-use graphics have also been created for Facebook, Twitter, and LinkedIn.
In a tweet, Professor Hawkins shared the world’s stripes for the period of 1850-2020 and said: “The planet is warming due to human activities, primarily burning fossil fuels & deforestation. “Climate change is happening here & now, and is already affecting everyone. The consequences will get worse for each bit of further warming.”
The campaign is supported by UN Climate Change, the World Meteorological Organisation and the Intergovernmental Panel on Climate Change, which hope to use the “Warming Stripes” to help build momentum towards the UN Climate Change Conference Cop26 which is taking place in Glasgow in December.
Join our commenting forum
Join thought-provoking conversations, follow other Independent readers and see their replies
Comments