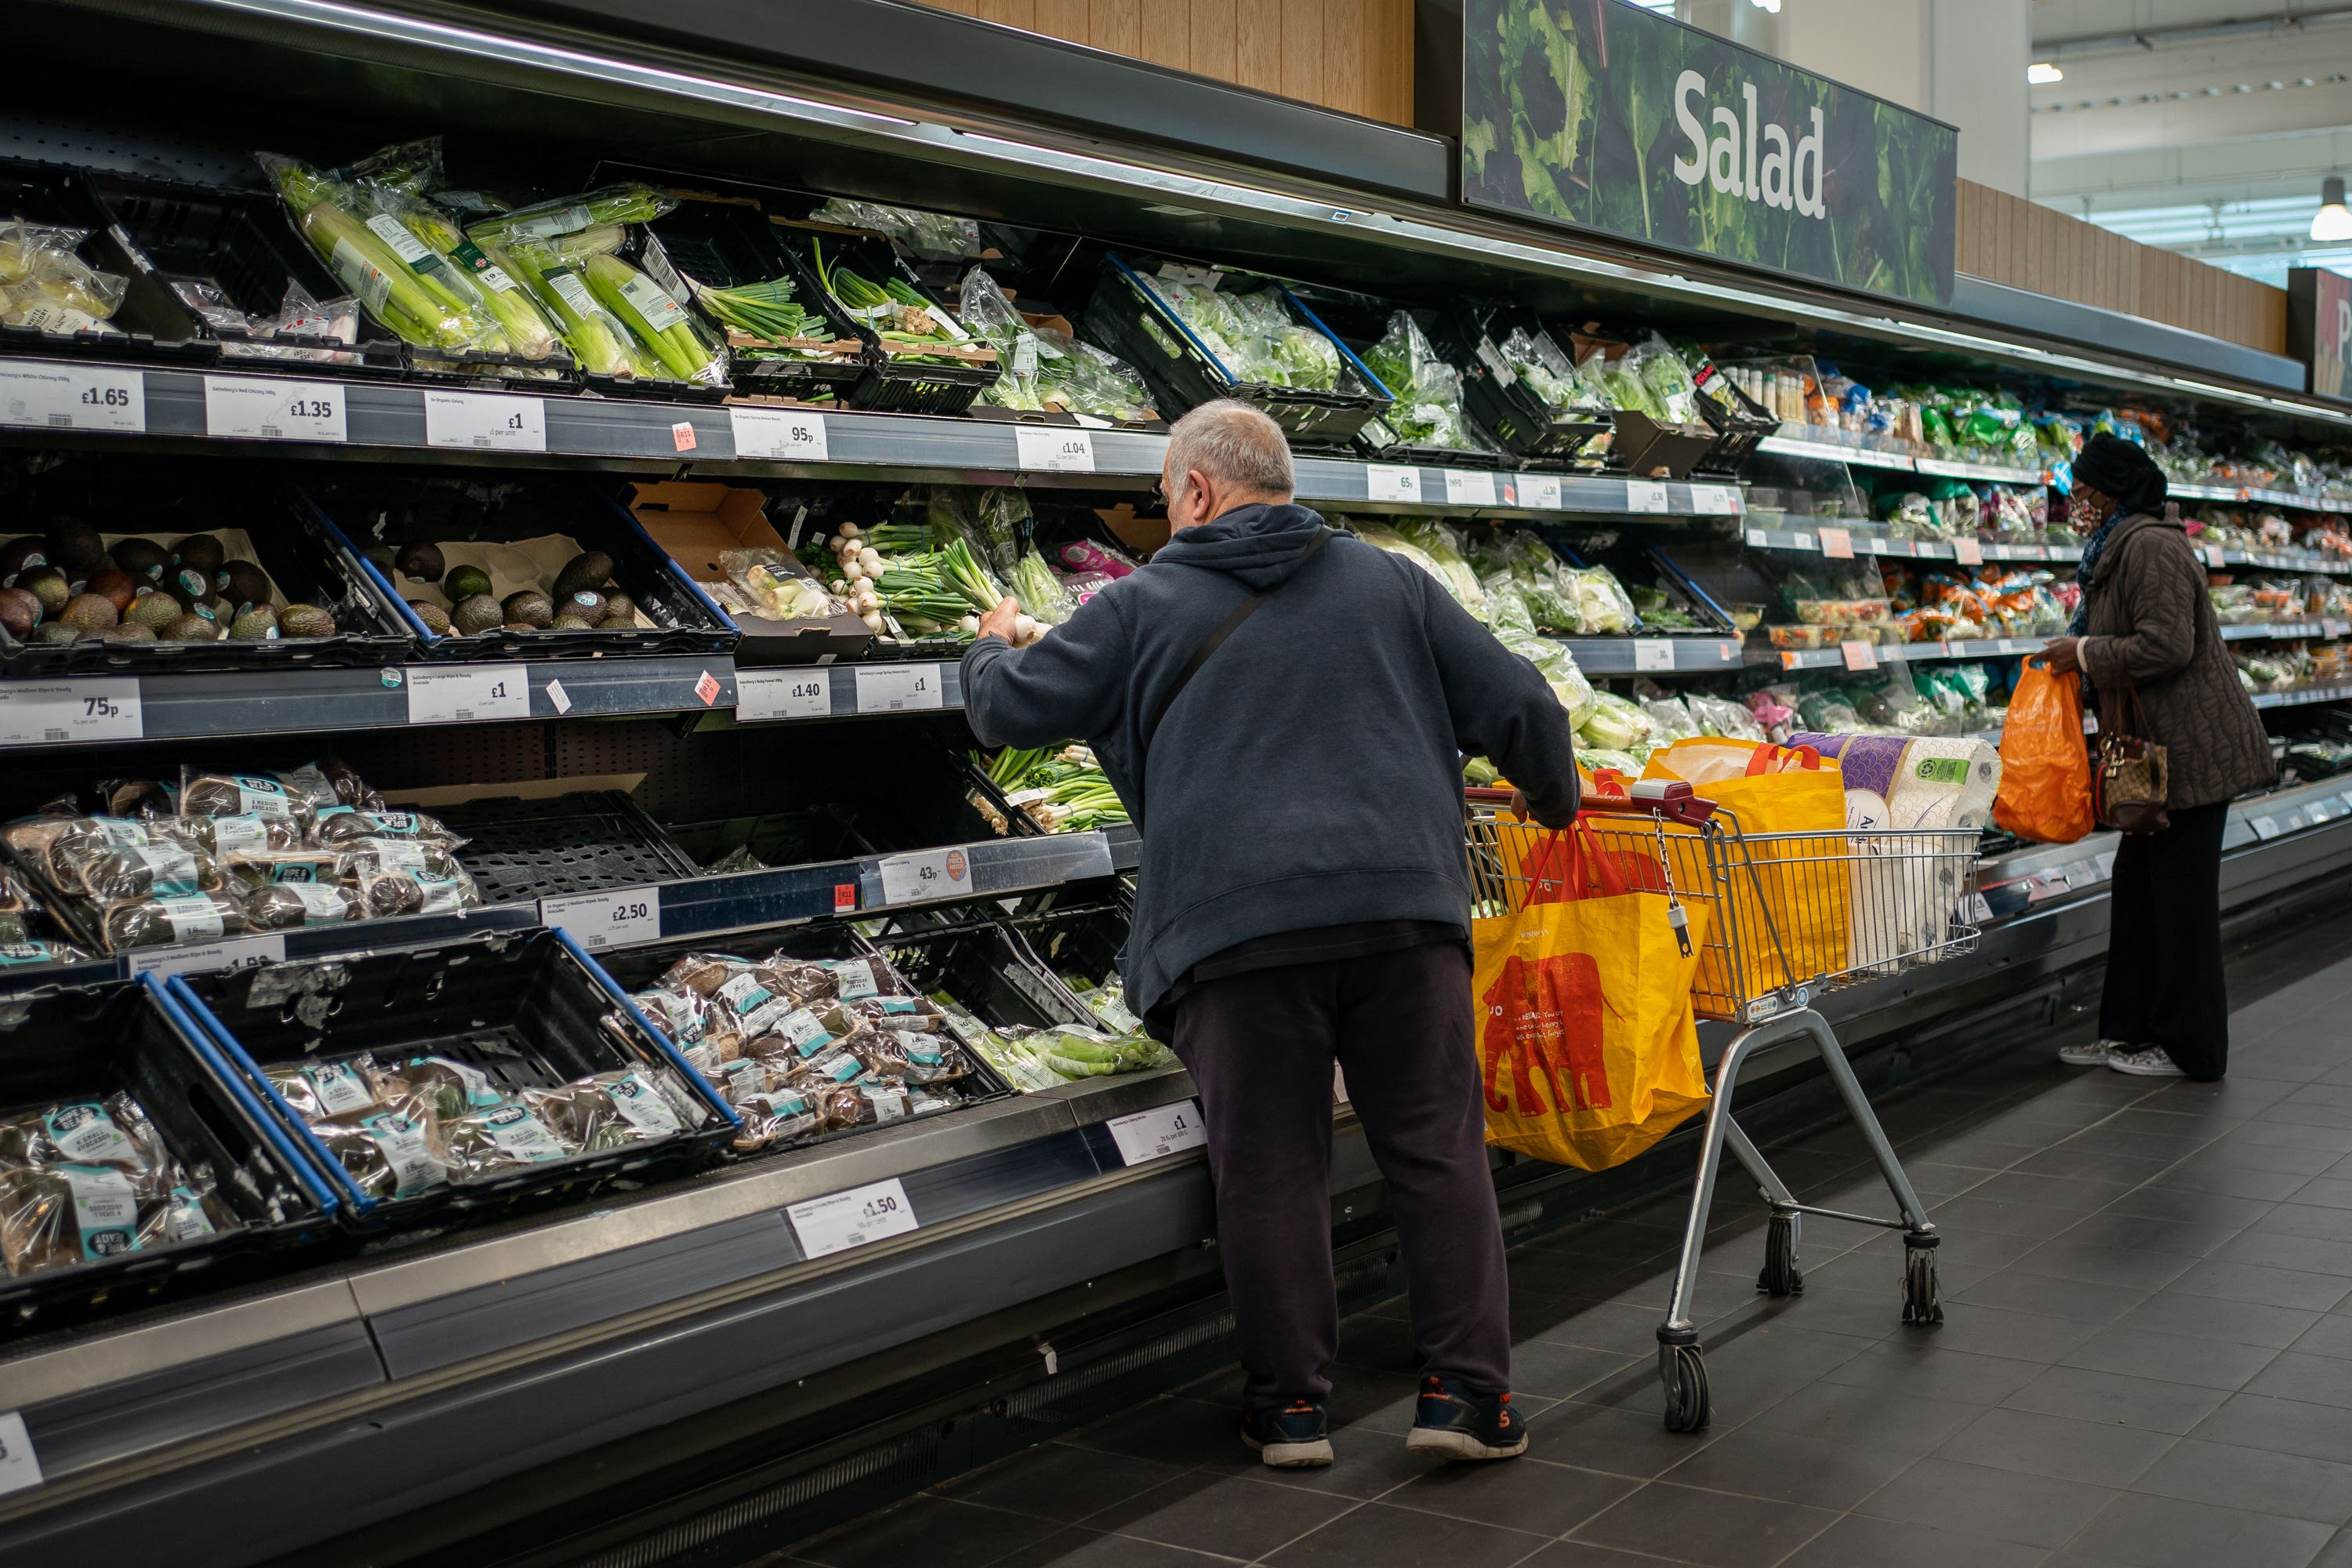
Which everyday items have seen a rise in inflation – and where has it eased?
Average prices for cigarettes increased by 15.7% in the year to December, compared with a jump of 11.8% in the year to November.

The unexpected rise in the overall level of inflation last month was driven by a jump in the rate for a handful of goods, notably tobacco and alcohol, but also a few everyday groceries including coffee, rice and fruit.
Average prices for cigarettes increased by 15.7% in the year to December 2023, compared with a rise of 11.8% in the year to November, while cigars increased by 13.8% compared with 9.7%.
Inflation has also accelerated for alcohol products, though not quite as fast.
The average price of beer increased by 12.8% in the year to December, up slightly from 12.0% in November, while spirits rose by 8.9%, up from 8.1%, and wine increased by 7.8%, up from 7.0%, according to Consumer Prices Index (CPI) data published by the Office for National Statistics (ONS).
Among the small number of food items that saw an acceleration in the rate of inflation last month were pizza and quiche, with average prices increasing by 5.1% in the year to December, up from 2.1% in the year to November; flour (up by 12.6% compared with 11.0%); rice (up by 7.9% compared with 7.2%) and fresh or chilled fruit (up by 6.7% compared with 6.0%).
Non-alcoholic drinks that saw a jump in the rate were coffee (up by 11.9% in December compared with 10.2% in November) and mineral water (up by 14.2%, compared with 12.8%).
A majority of everyday products and services saw an easing of inflation last month, however.
Eggs saw a particularly sharp slowdown, with average prices up by 6.8% in the year to December, down from a jump of 12.9% in November.
Sugar, yoghurt, olive oil, fish, children’s shoes and fruit juices all saw inflation at least three percentage points lower in December than in November.
The average cost of petrol was down year-on-year by 8.0% in December, a larger fall than the drop of 7.7% in November, reflecting the decrease in prices last month.
Similarly, the average cost of a second-hand car was down by 8.4% in the year to December, a larger fall than the drop of 5.4% the previous month.
Below is a list of examples of how the CPI inflation rate has either accelerated or slowed, ranked by the size of the month-on-month change, starting with the largest.
Two figures are listed for each item – the average rise in price in the 12 months to November, followed by the average rise in price in the 12 months to December.
– Examples where inflation has accelerated:
Coffee machines, tea makers and similar appliances: Nov: 0.9%, Dec 9.0%Cigars: Nov 9.7%, Dec 13.8%Cigarettes: Nov 11.8%, Dec 15.7%Furnishings fabrics and curtains: Nov 3.1%, Dec 6.9%Pizza and quiche: Nov 2.1%, Dec 5.1%Children’s clothes: Nov 6.7%, Dec 9.6%Cookers: Nov 4.8%, Dec 6.9%Coffee: Nov 10.2%, Dec 11.9%Women’s footwear: Nov 2.0%, Dec 3.7%Mineral or spring waters: Nov 12.8%, Dec 14.2%Men’s clothes: Nov 4.2%, Dec 5.2%Spirits: Nov 8.1%, Dec 8.9%Beer: Nov 12.0%, Dec 12.8%Wine: Nov 7.0%, Dec 7.8%Rice: Nov 7.2%, Dec 7.9%Fresh or chilled fruit: Nov 6.0%, Dec 6.7%
– Examples where inflation has slowed:
Sugar: Nov 40.4%, Dec 21.3%Yoghurt: Nov 17.4%, Dec 8.6%Olive oil: Nov 53.9%, Dec 45.8%Children’s footwear: Nov 12.2%, Dec 4.9%Eggs: Nov 12.9%, Dec 6.8%Fish: Nov 6.5%, Dec 2.4%Whole milk: Nov -7.0%, Dec -11.0%Fruit and vegetable juices: Nov 13.6%, Dec 10.4%Low fat milk: Nov -3.0%, Dec -6.1%Second-hand cars: Nov -5.4%, Dec -8.4%Breakfast cereals: Nov 11.5%, Dec 8.7%Potatoes: Nov 12.2%, Dec 9.6%Passenger air travel: Nov 3.3%, Dec 0.8%Cheese and curd: Nov 7.1%, Dec 5.1%Tea: Nov 13.1%, Dec 11.3%Pasta and couscous: Nov 8.2%, Dec 6.6%Ready-made meals: Nov 7.5%, Dec 6.0%Chocolate: Nov 11.2%, Dec 9.8%Sauces, spices and culinary herbs: Nov 19.7%, Dec 18.4%Soft drinks: Nov 4.7%, Dec 3.5%Passenger train travel: Nov 5.0%, Dec 3.8%Household furniture: Nov 2.4%, Dec 1.2%Bread: Nov 3.2%, Dec 2.2%Crisps: Nov 12.8%, Dec 11.8%
Bookmark popover
Removed from bookmarks